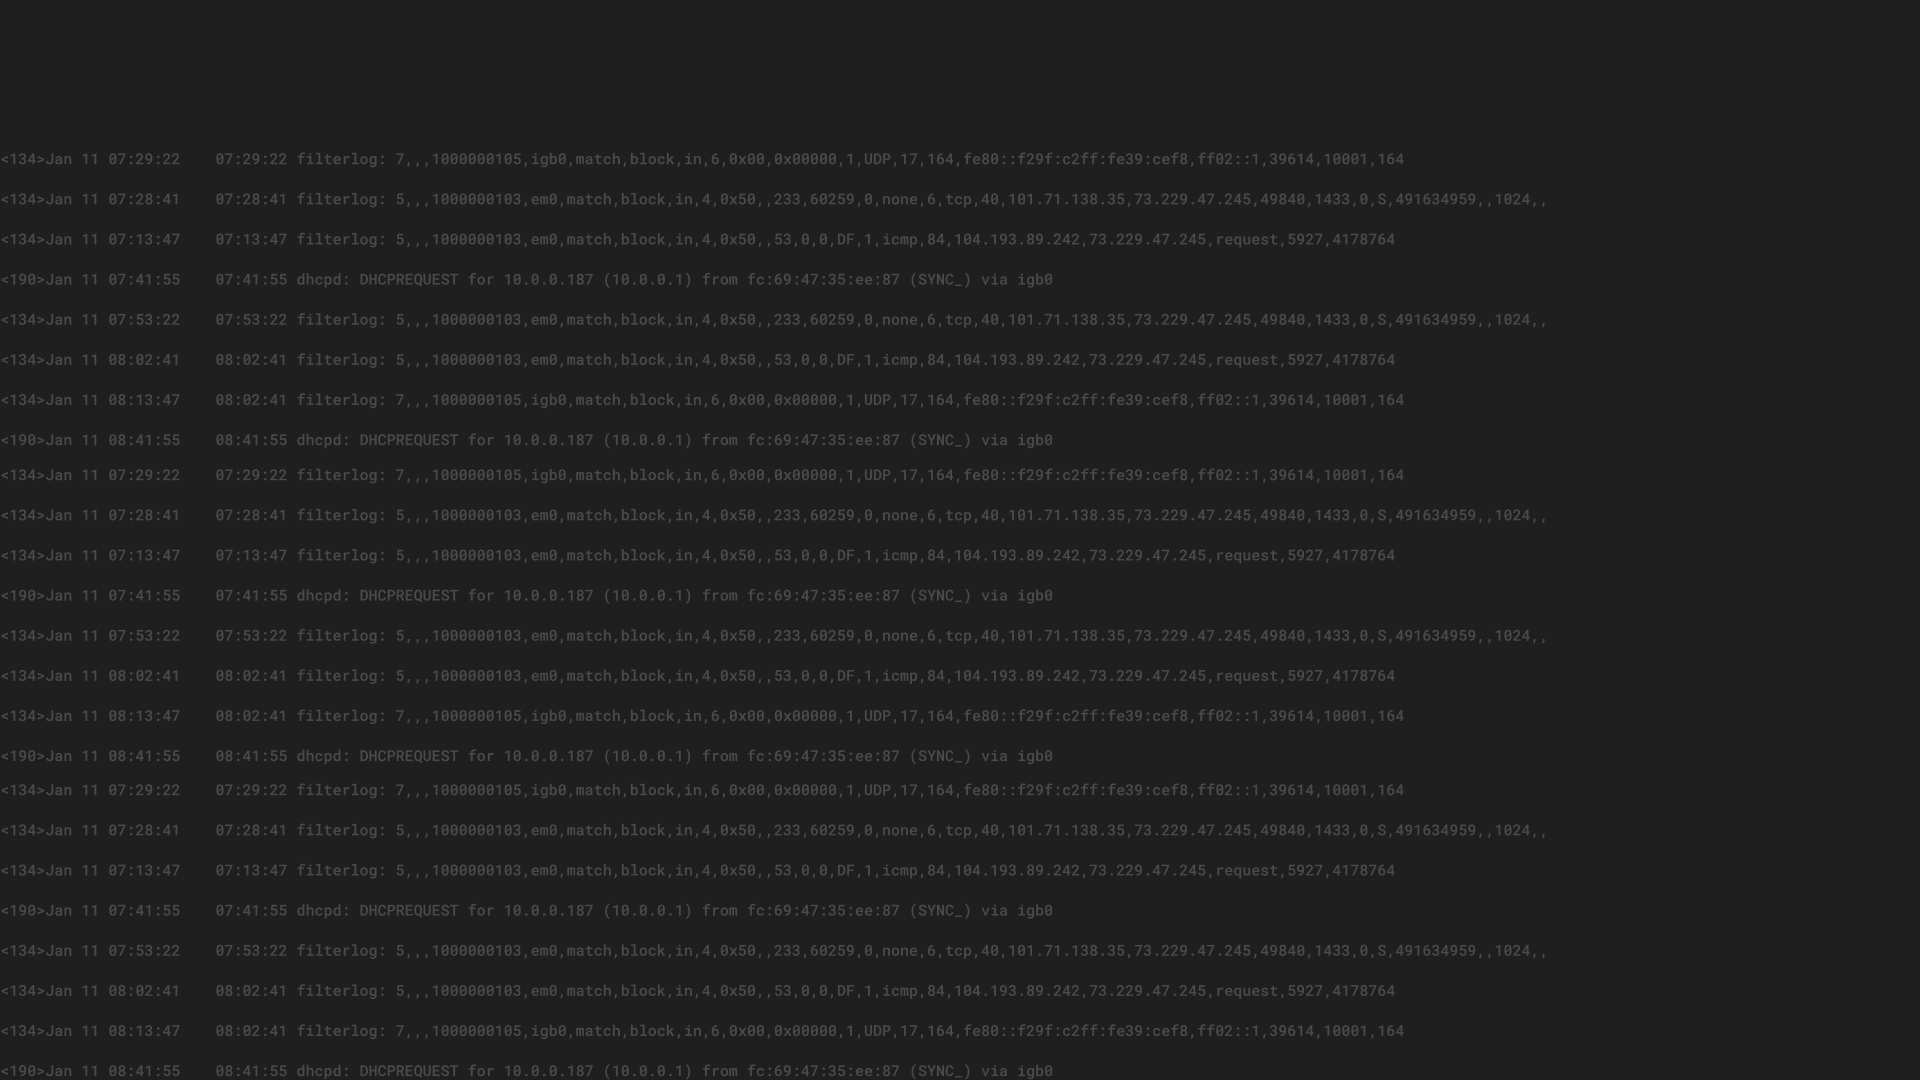
Centralized log collection has become a necessity for many organizations. Much of the data we need to run our operations and secure our environments comes from the logs generated by our devices and applications. Centralizing these logs creates a large repository of data that we can query to enable various types of analysis. The most common types are conditional analysis and trend analysis. They both have their place, but trend analysis is perhaps the more often underutilized source of information.
Before we jump into what I mean by that, let’s define our terms.
Conditional Analysis
Conditional analysis is the act of looking for events that meet a set of conditions determined by the analyst. The first type, single condition analysis, could also be called “binary” analysis. It’s a yes or no proposition. We try to determine if an event did or didn’t happen. For example, we might look for an event (let’s call it “Event X”) from our endpoint security solution that tells us we have a compromised user workstation. If we see Event X, we respond. If not, we don’t. SIEM and other log analysis tools are good at finding these infrequent, but very important, events and bringing them to our attention. We can even automate this analysis and get an alert each time that Event X occurs.
For many, the next step is to stack conditions, looking for instances where multiple conditions are met. A simple example of multiple condition analysis might be a search for multiple failed logins from a single source followed by a successful login. This scenario could represent an attacker running through a list of passwords before hitting on a correct one and successfully gaining access. Again, SIEM and log analysis tools can bring these instances to our attention.
Trend Analysis
Trend analysis takes a different approach. Trends examine events over time, looking for patterns or indicators. Though sometimes a direct indicator exists, trends more often help analysts infer information, giving clues that can be followed to more direct indicators that might otherwise be missed. These could include changes in the frequency of events, total volume of events, or deviations in particular values.
Frequency
A change in the frequency of events can indicate many things. The frequency of a specific event, such as failed logins, can tell you someone is poking around in your network, or it may alert you to a service account that has an expired password. Similarly, trend analysis could alert you to a sudden spike in the number of connection attempts to a publicly available service, possibly as part of a denial of service attack.
Volume
A change in the overall volume of events can be indicative of an issue as well. The most obvious example would be a significant change in the overall number of collected events. A large unexplained increase in the number of collected events might be the first indication of an attack in progress or an operational issue that is spiraling out of control. The opposite is also true–a complete lack of events from a system over a period of time may be the only indication that it has failed.
Statistical Deviations
The first two types of trends are usually not hard to spot. A huge spike in the number of inbound connections is going to stick out like a sore thumb. It may turn out to have a benign cause, but you can’t miss it if you are looking. However, there are some changes that are more subtle and don’t always lend themselves to simple analysis. Often, finding a relatively small change in the values contained in certain events can be useful. When combined with statistical analysis, it can alert analysts to more gradual trends.
For example, a huge change in the number of Bytes Out through a firewall might be immediately noticeable to an analyst. However, using trend analysis, that same analyst can see that Bytes Out has been 15% higher than average for the past two days for the network as a whole. This change alone might not be enough to confirm something is amiss, but further analysis shows that most of that increase comes from a single server. The trend did not tell us exactly what was wrong, but it did allow us to infer that something was happening and focus further analysis to isolate the source.
There are many more examples, with use cases outside of security as well. Deviations from average are the simplest of analyses. In addition to mean, some SIEM and log management solutions can analyze changes in mode, mean minimum, maximum, or even variance of values by standard deviations to reveal patterns that are not apparent through other methods.
A few of the common values that lend themselves to statistical analysis include:
- Bandwidth
- Latency
- Response times
- Application failures
- Logins
- Account lockouts
- Retries
- Bytes in
- Bytes out
- Denied connections
- DNS queries
Conclusion
Although it takes a bit more thought and often requires more investigation than either binary or stacked condition analysis, trend analysis provides rich information. Trends can yield insights into the operational and security health of your network that are otherwise difficult to discern. Collect the event logs and create the analysis that works for you, remembering to automate as much as possible. No pre-built content can replace your own knowledge of how your organization should work. The key to successful trend analysis is to find the events and values that matter in your environment.


