
In today’s digital age, the internet has become an integral part of our daily lives. From working remotely to streaming movies, we rely on the internet for almost everything. However, slow internet speeds can be frustrating and can significantly affect our productivity and entertainment. Despite advancements in technology, many people continue to face challenges with their internet speeds, hindering their ability to fully utilize the benefits of the internet. In this blog, we will explore how Dan McDowell, Professional Services Engineer decided to take matters into his own hands and get the data over time to present to his ISP.

Over the course of a few months, I noticed slower and slower internet connectivity. Complaints from neighbors (we are all on the same ISP) lead me to take some action. A few phone calls with “mixed” results were not good enough for me so I knew what I needed, metrics!
Why Metrics?
Showing data without a doubt is one of the most powerful ways to prove a statement. How often do you hear one of the following when you call in for support:
- Did you unplug it and plug it back in?
- It’s probably an issue with your router
- Oh, wireless must be to blame
- Test it directly connected to your computer!
- Nothing is wrong on our end, must be yours…
In my scenario I was able to prove without a doubt that this wasn’t a “me” problem. Using data I gathered by running this script every 30 minutes over a few weeks time I was able to prove:
- This wasn’t an issue with my router
- The was consistent connectivity slowness at the same times every single day of the week and outside of those times my connectivity was near the offered maximums.
- Something was wrong on their end
- Clearly, they were not spec’d to handle the increase in traffic when people stop working and start streaming
- I used their OWN speed test server for all my testing. It was only one hop away.
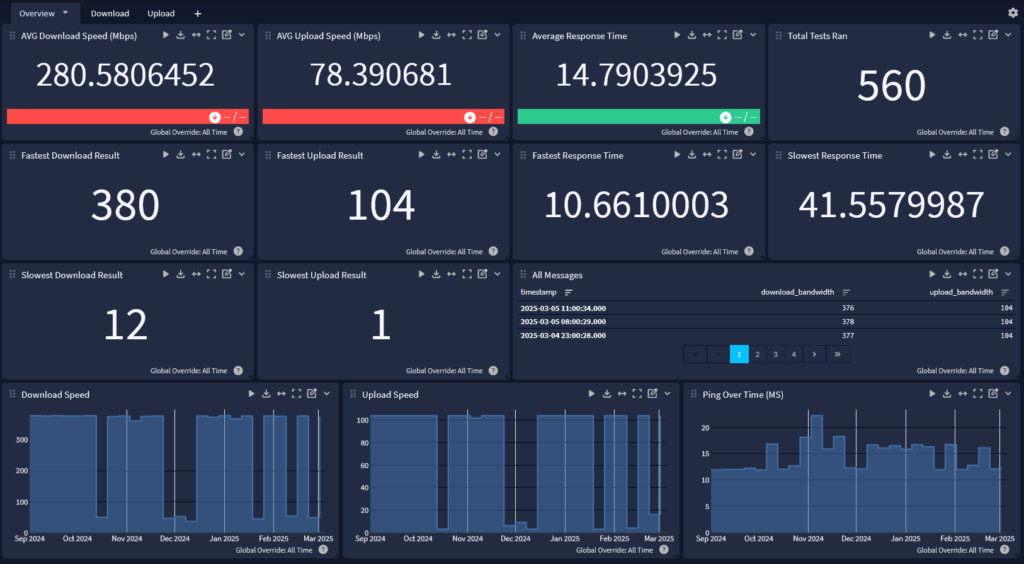
- This was all the proof I needed:
- End Result?
- I sent in a few screenshots of my dashboards, highlighting the clear spikes during peak usage periods. I received a phone call not even 10 minutes later from the ISP. They replaced our local OLT and increased the pipe to their co-lo.
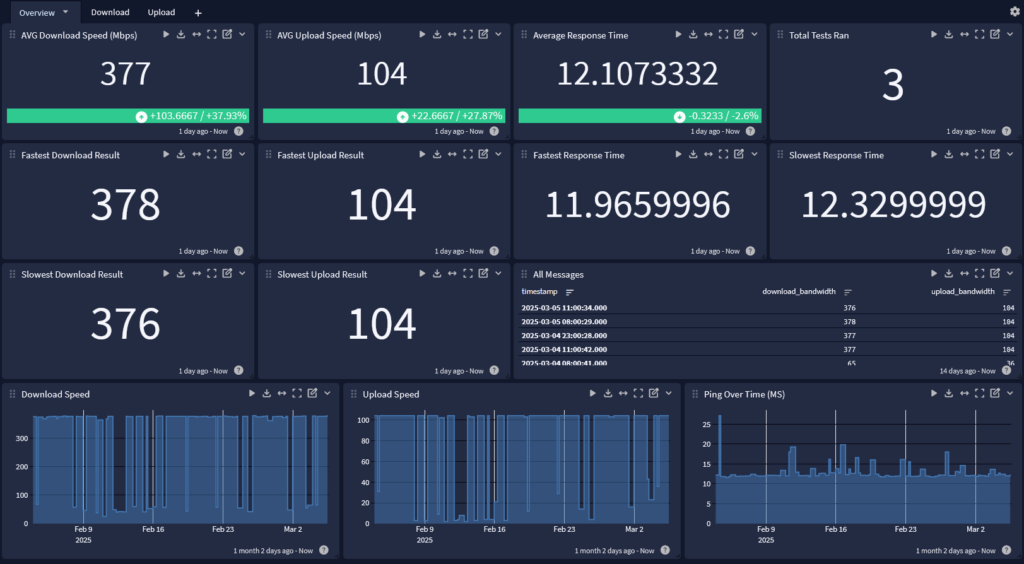
What a massive increase in average performance!
- I sent in a few screenshots of my dashboards, highlighting the clear spikes during peak usage periods. I received a phone call not even 10 minutes later from the ISP. They replaced our local OLT and increased the pipe to their co-lo.

Ookla Speedtest has a CLI tool?!
Yup. This can be configured to use the same speedtest server (my local ISP runs one) each run meaning results are valid and repeatable. Best of all, it can output JSON which I can convert to GELF with ease! In short, I setup a cron job to run my speed test script every 30 minutes on my Graylog server and output the results, converting the JSON message into GELF which NetCat sends to my GELF input.
PORT 8080 must be open outbound!
How can I even?
Prerequisites
1. Install netcat, speedtest and gron.
Debain/Ubuntu
2. curl -s https://packagecloud.io/install/repositories/ookla/speedtest-cli/script.deb.sh | sudo bash
sudo apt install speedtest gron ncat
RHEL/CentOS/Rocky/Apline
wget https://download-ib01.fedoraproject.org/pub/fedora/linux/releases/37/Everything/x86_64/os/Packages/g/gron-0.7.1-4.fc37.x86_64.rpm
sudo dnf install gron-0.7.1-4.fc37.x86_64.rpm curl -s https://packagecloud.io/install/repositories/ookla/speedtest-cli/script.rpm.sh | sudo bash
sudo dnf install speedtest netcat
3. You also need a functional Graylog instance with a GELF input running.
4. My speedtest script and Graylog content pack (contains dashboard, route rule and a stream)
- Grab the script
wget https://raw.githubusercontent.com/graylog-labs/graylog-playground/main/Speed%20Test/speedtest.sh
- Move the script to a common location and make it executable
mkdir /scripts
mv speedtest.sh /scripts/
chmod +x /scripts/speedtest.sh
Getting Started
- Login to your Graylog instance
- Navigate to System → Content Packs
- Click upload.
- Browse to the downloaded location of the Graylog content pack and upload it to your instance
- Install the content pack
- This will install a Stream, pipeline, pipeline rule (routing to stream) and dashboard
- Test out the script!
- ssh / console to your linux system hosting Graylog/docker
- Manually execute the script:
/scripts/speedtest.sh localhost 12201
Script Details: <path to script> <ip/dns/hostname> <port>
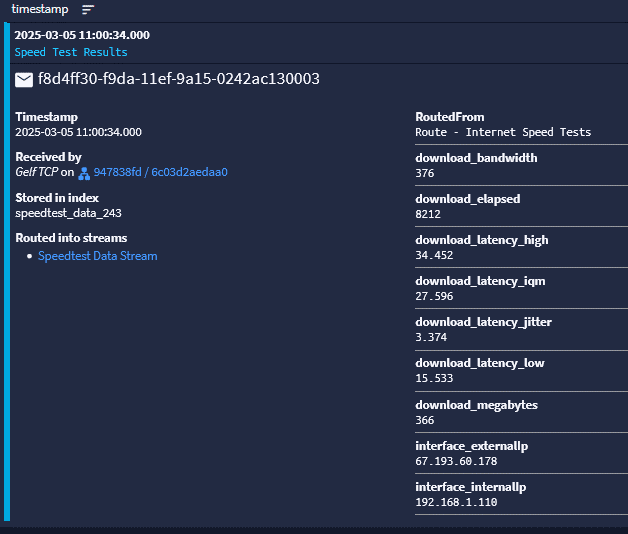
- Check out the data in your Graylog
- Navigate to Streams → Speed Tests
- Useful data appears!
- Navigate to Dashboards → ISP Speed Test
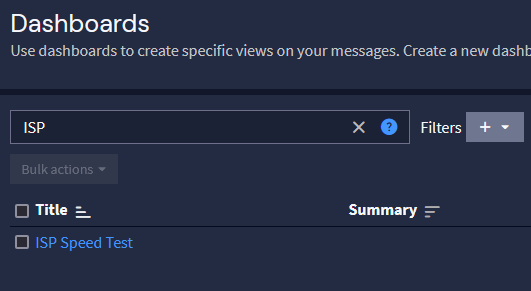
- Check out the data!
- Check out the data!
- Manually execute the script as much as you like. More data will appear the more you run it.


Automate the Script!
This is how I got the data to convince my ISP that something was actually wrong. Setup a CRON job that runs every 30 minutes and within a few day you should see some time related changes.
- ssh or console to your linux system hosting the script / Graylog
- Create a CRONTAB to run the script every 30 minutes
- create crontab (this will be for the currently logged in user OR root if sudo su was used)
crontab -e
-
- Set the script to run every 30 minutes (change as you like)
*/30 * * * * /scripts/speedtest.sh localhost 12201
- That’s it! As long as the user the crontab was made for has permissions, the script will run every 30 minutes and the data will go to Graylog . The dashboard will continue to populate for you automatically.

Bonus Concept – Monitor you Sites WAN Connection(s)
This same script could be used to monitor WAN connections at different sites. Without any extra fields, we could use the interface_externalIp or source fields provided by the speedtest cli/sending host to filter by site location, add a pipeline rule to add a field biased on a lookup table or add a single field to the speedtest GELF message (change the script slightly) to provide that in the original message, etc. Use my dashboard to make a new dashboard with tabs for per-site and a summary page! The possibilities are endless.
Most of all, go have fun!

Dan
