
In this post, I will describe in detail how to use the Threat Intelligence plugin that ships with Graylog. I’ll start with the steps necessary to prepare your data, then explain how to activate the feature and how to configure it for use.
PREPARATION
To use the built in Threat Intelligence plugin, Graylog version 3.0 or later is required.
The first step is to choose which log event sources you want to compare against. Today, the Graylog Threat Intelligence Plugin allows lookups of IP addresses and domain names. Given that, choose an event source that contains one or both of these types of data. Most people start with firewalls, although we can also look at IDS, DNS, Authentication, or web server logs, just to name a few.
Now identify the fields we want to use for comparison. We will choose source IP address (src_addr), destination IP address (dst_addr), and domain name (domain).
These sorts of lookups are where normalization of event field names becomes important. Graylog permits any field name for any field, but if we use the same field name for destination address, regardless of which product we collect it from, then the destination address will always be in one place, and only one place. If we normalize our field names, we can use a single rule to do the lookups. If not, we may have several fields to deal with individually (e.g., src_addr, source_IP, source_address, etc.), adding unnecessary complexity. The same holds true for search queries and dashboards, so best practices dictate that we determine a naming convention prior to installation and follow that convention for all new event sources that are added.
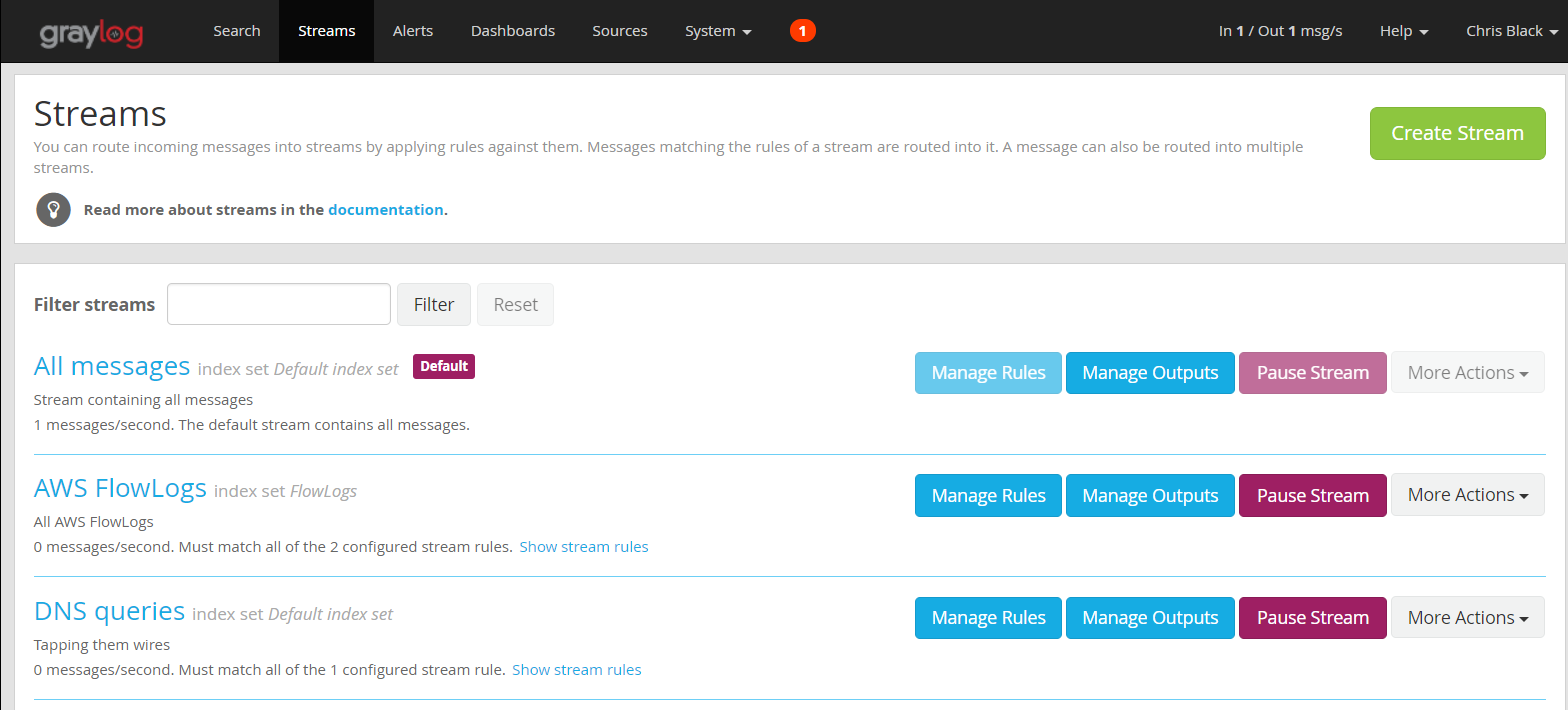
We must also select the streams in Graylog that we want to include in this lookup processing. We can use an existing stream or create a new one. Multiple streams may be tied to the pipeline we will create. We must be careful though–we don’t want to apply these lookups to messages without the correct fields, since that would mean we evaluate every single message that we collect, regardless of whether or not the data we need is contained within. It’s better to choose streams that include only the event sources we know contain the fields we need. In this example, we will use the “AWS FlowLogs” and “DNS queries” streams.
Now it’s time to install the plugin.
Configuring the Threat Intelligence Plugin
Graylog 3.0+ ships with the Threat Intelligence Plugin pre-installed only needing activation to use the services. To enable choose:
- Go to the System/Configurations page.
- Find the Plugins section.
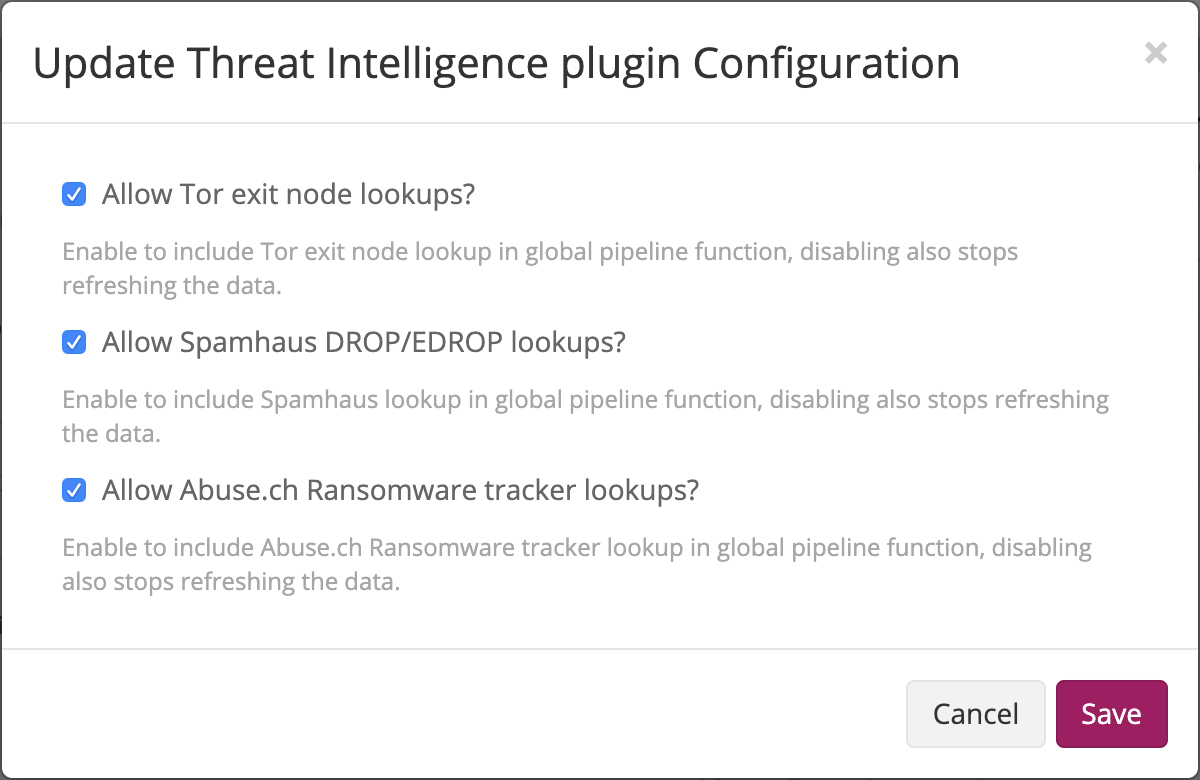
- Click on the Configure button.
- Select the services you want to use.
Once you have selected which services to use, create the pipeline processor needed to make the comparisons:
- Go to System/Pipelines.
- Click the Add New Pipeline button.
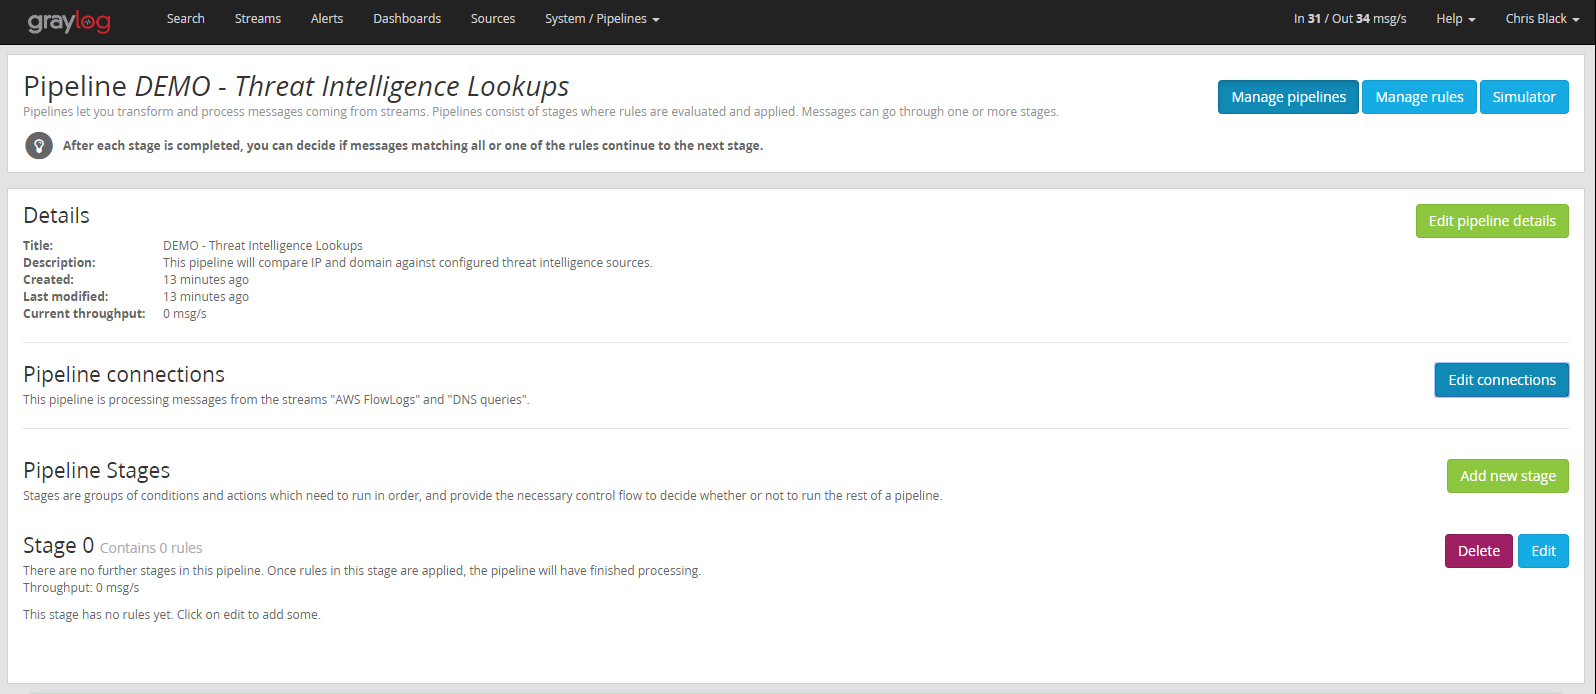
- Name your pipeline and write a description if you would like. You will see the newly created Pipeline’s configuration page.
- Using the Edit Connections button, associate the streams we selected earlier with this pipeline.
Next create the rules required for the lookups:
- Click on the Manage rules button.
- Click the Create Rule button.
- Add a description.
- Add the rule source code and save.
For this example, we will create three rules, one for each type of lookup we want to perform.
Rules
Rule #1
rule “Threat Intelligence Lookups: domain”
when
 has_field(“domain”)
then
 set_fields(threat_intel_lookup_domain(to_string($message.domain), “domain”));
end
Rule #2
rule "Threat Intelligence Lookups: dst_addr"
when
 has_field("dst_addr")
then
 set_fields(threat_intel_lookup_ip(to_string($message.dst_addr), "dst_addr"));
end
Rule #3
rule "Threat Intelligence Lookups: src_addr"
when
 has_field("src_addr")
then
 set_fields(threat_intel_lookup_ip(to_string($message.src_addr), "src_addr"));
end
Rule #4
rule "OTX Lookup: src_addr"
when
 has_field("src_addr")
then
 let intel = otx_lookup_ip(to_string($message.src_addr));
 set_field("threat_indicated", intel.otx_threat_indicated);
 set_field("threat_ids", intel.otx_threat_ids);
 set_field("threat_names", intel.otx_threat_names);
end
Once the rules are created, we must add them to a pipeline stage. We will edit the default Stage 0 in our newly created pipeline and add the rules we created in the previous step.
The finished pipeline looks like this:

From now on, each message that matches one of our two streams (AWS FlowLogs or DNS queries) will be routed to this pipeline processor. The lookup will be performed on those messages that contain the fields “domain”, “src_addr”, or “dst_addr”. For each message that matches, a new field will be added to the message, “X_threat_indicated”. (X represents the name of the field we compared against.) For example, it would be “src_addr_threat_indicated” or prefixed by one of the other two fields we checked. This newly created field will contain the value “true”.
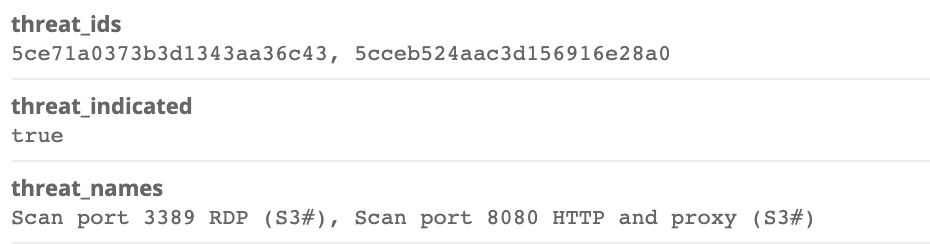
For the last rule on OTX lookups, if a threat is found by the src_addr, three additional fields will be set: “threat_indicated”, “threat_ids”, and “threat_names”
To search for matches, we can simply run the following query:
Src_addr_threat_indicated:true AND threat_indicated:true
This field may be used for searches, alerts, or dashboards like any other field.
CONCLUSION
In this post, I have described how to enable and configure Graylog’s Threat Intelligence Plugin. Today, the plugin works with only the specified threat intelligence feed providers. More will be added in later versions, so watch this space for announcements.
Don’t worry if your feed provider is not supported though. Integration with most other types of threat intelligence feed providers is also possible, using lookup tables created by the user. It is a bit more manual but, if you are adventurous, you can probably work out how to do it by looking at the Threat Intelligence plugin default content. I also plan to provide a detailed explanation of how to do it in a later post.
