
INTRODUCTION
In this post, the second of our series, we will take a look at how you can analyze network traffic data in order to detect network intrusions. Every phase of intrusion (phases we’ve outlined in our first blog post) will leave traces and with the correct tools in place, you can detect these early on and take countermeasures.
The first part of this article is how to collect data and what high level network logs look like. If you are already comfortable with this, skip ahead to “Analyze the data you are collecting” for examples on what to look out for.
COLLECT DATA AND MAKE IT OBSERVABLE
NETWORK LAYER LOGS
The most important source of data is your network layer logs. By collecting high level information on the IP address, time communicated, and port and protocol used, you will get a very complete overview of the factual network activity. This is very important because what you think is happening in your network is not the complete picture .
These high level network layer logs will look like the example below:
2016-07-21 16:28:49.523 ACCEPT TCP 172.30.0.76:22 -> 172.30.0.120:38920
This log message tells you the following:
What this tells us, most importantly, is that 172.30.0.76 is talking to 172.30.0.120 and has a successfully established connection.These high level logs will not actually record the data that is being transferred or even inspect the traffic to extract metadata. This is simply to record traffic flow.
HOW TO COLLECT NETWORK LAYER LOGS
The most popular way to collect network layer logs is forwarding them directly from your routers, firewalls and switches using a protocol like Netflow, and into Graylog. (Graylog Netflow Input)
Most professional devices support Netflow forwarding natively and the configuration is described in the documentation your vendor provides.
An alternative is using network taps that will sit in the middle of a physical network cable and forward a copy of the wire data 1:1 to another host on the network. This host can parse the data and forward it to Graylog.

(A simple network tap in our lab. Forwarding all data directly from the wire to a Raspberry Pi, which is forwarding it to Graylog.)
If you are using a public cloud, you will usually not have access to Netflow or even tap logs. If you are lucky, your provider will still allow access to network layer logs. AWS, for example, has a FlowLog API and the upcoming v1.0 release of our AWS Graylog Plugin can read and parse those for all your VPC’s network interfaces, including those attached to EC2, RDS and ELB instances.
Note that there are legal implications of listening to network data in many countries and you should definitely check with a lawyer.
ANALYZE THE DATA YOU ARE COLLECTING
Once you have started collecting the data, you can begin to analyze it to detect and mitigate malicious activity.
Below are three specific examples on how to use Graylog to monitor your network security.
1. Outside connections to internal services
You will usually have two kinds of expected and allowed connection patterns:
If a purely internal system is accessed directly from the outside, this is something you want to further investigate. The connections you are seeing might just be harmless automated port scans, but the next time it could be a sophisticated attacker on a mission.
A Graylog query could look like this:
from_internal:false AND action:ACCEPT
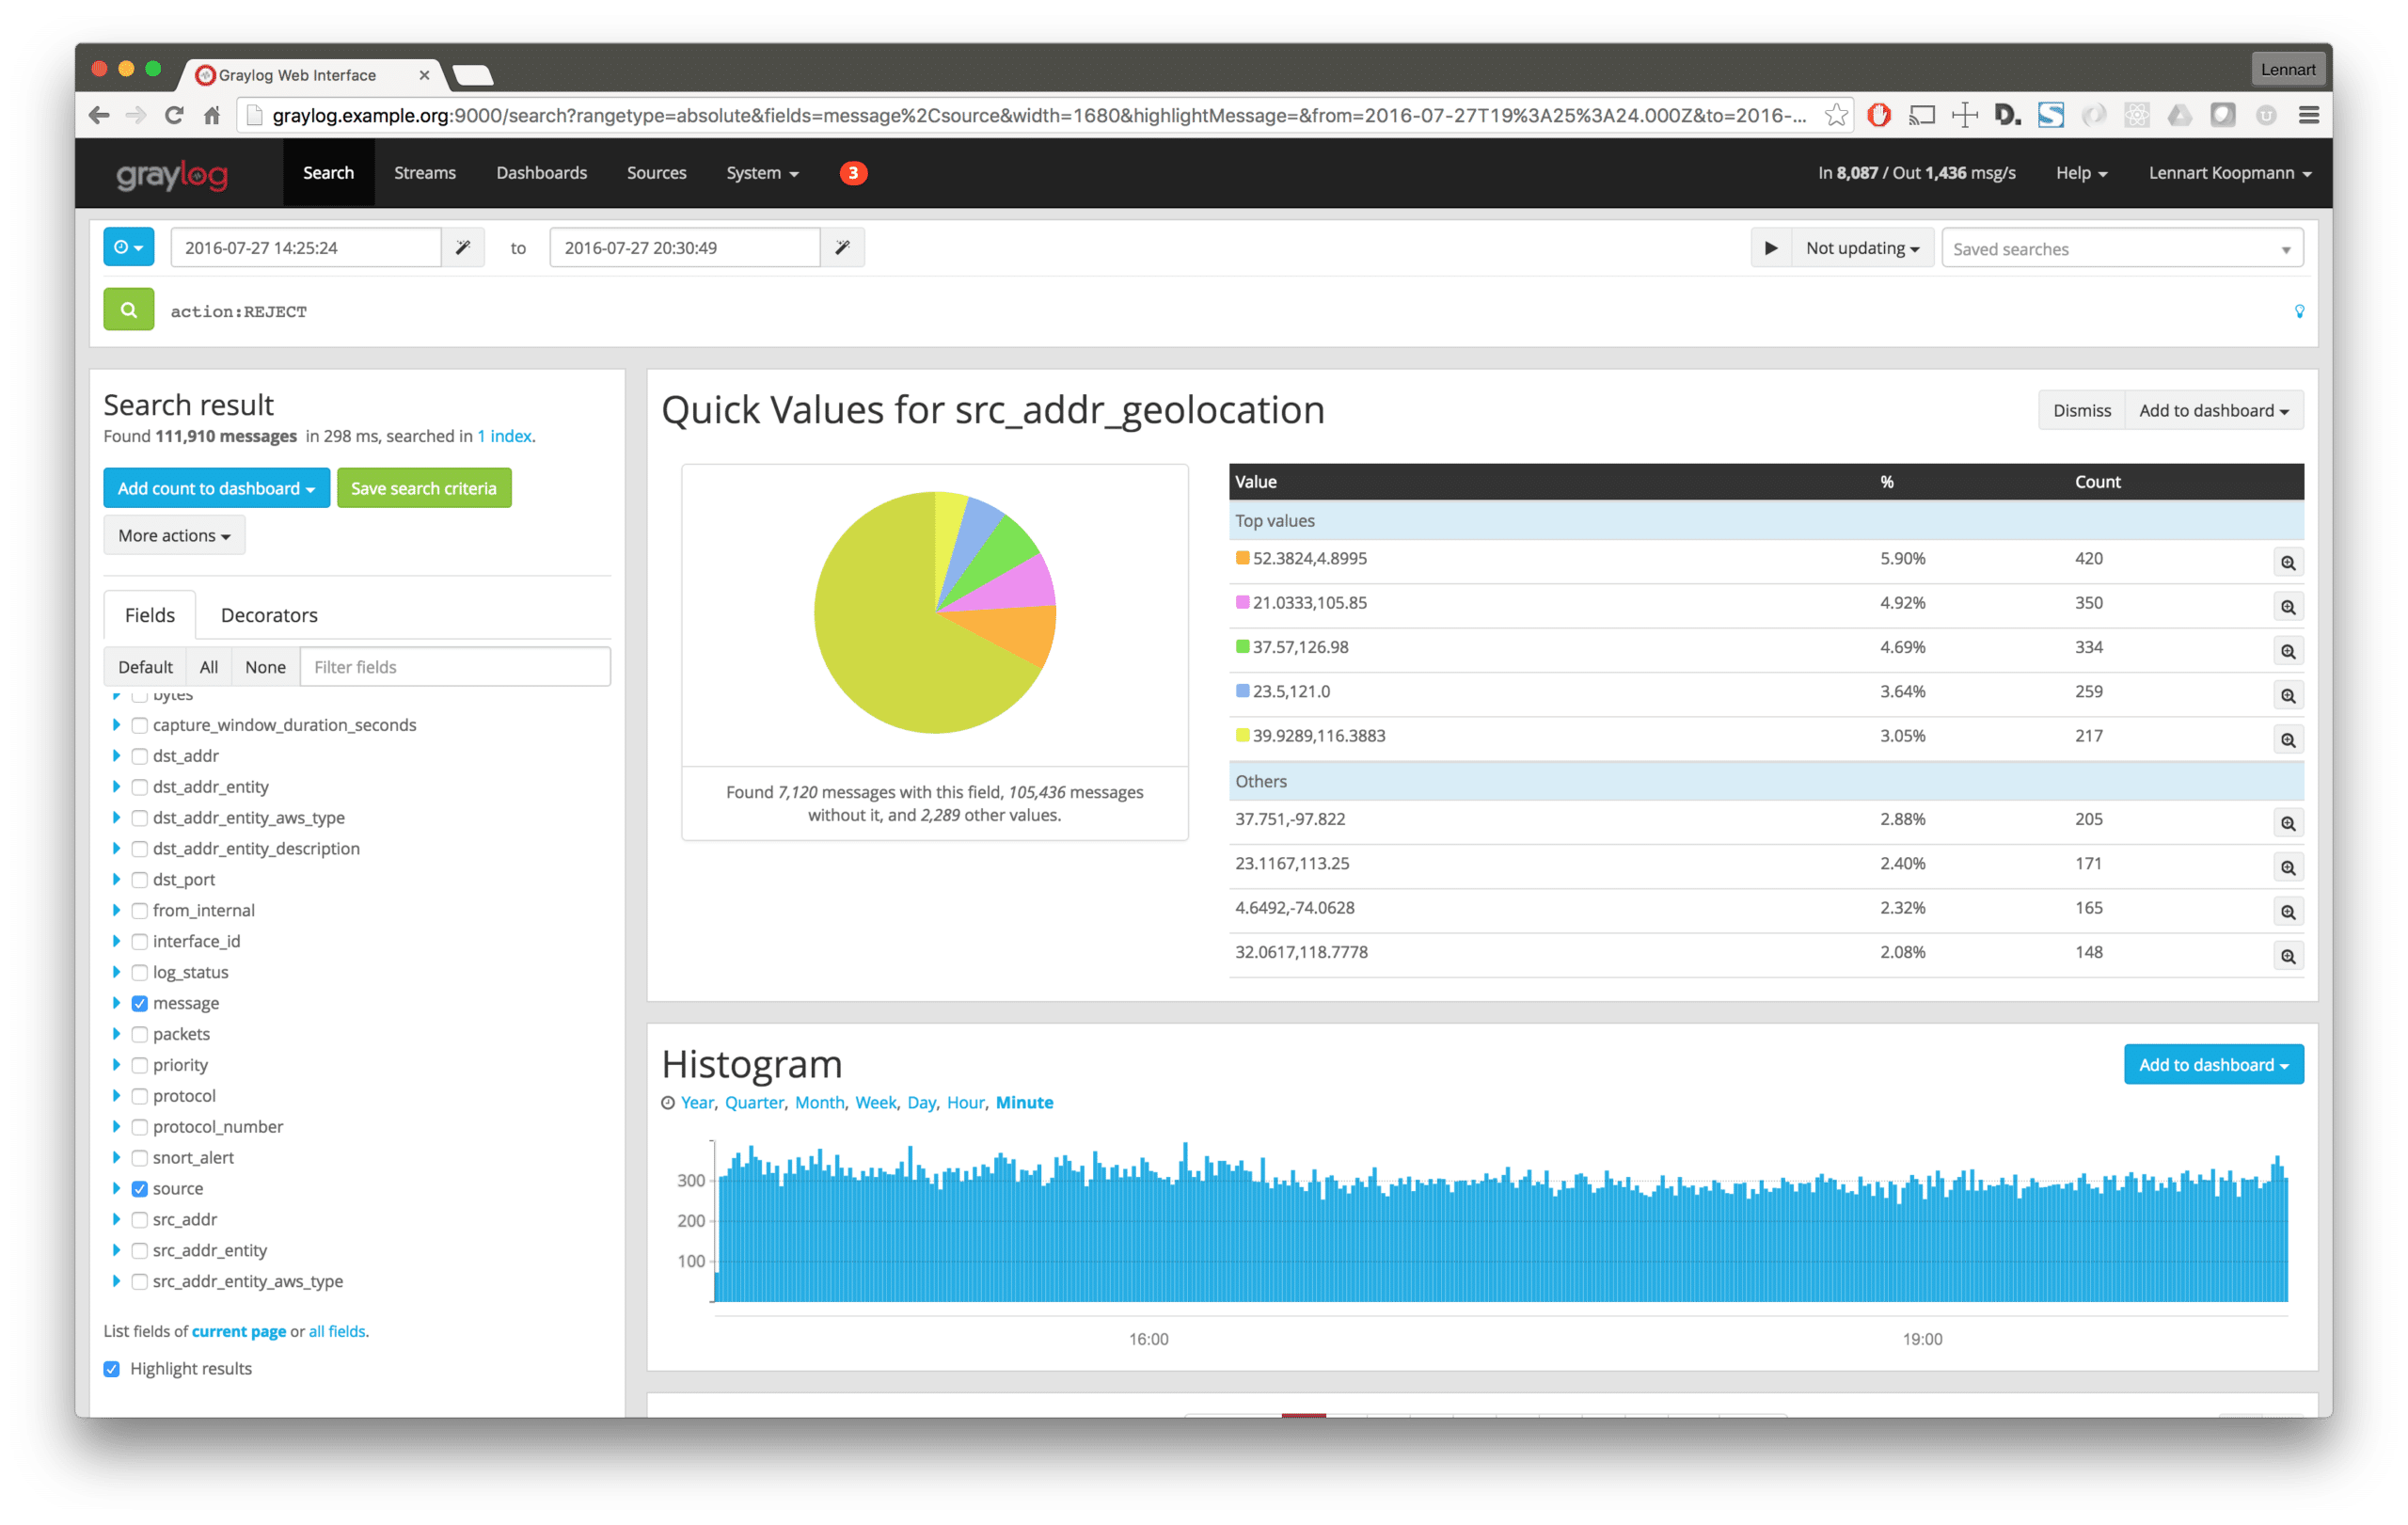
By using the quick values analysis to get the top destination addresses, you can determine if those should accept outside connections or not:
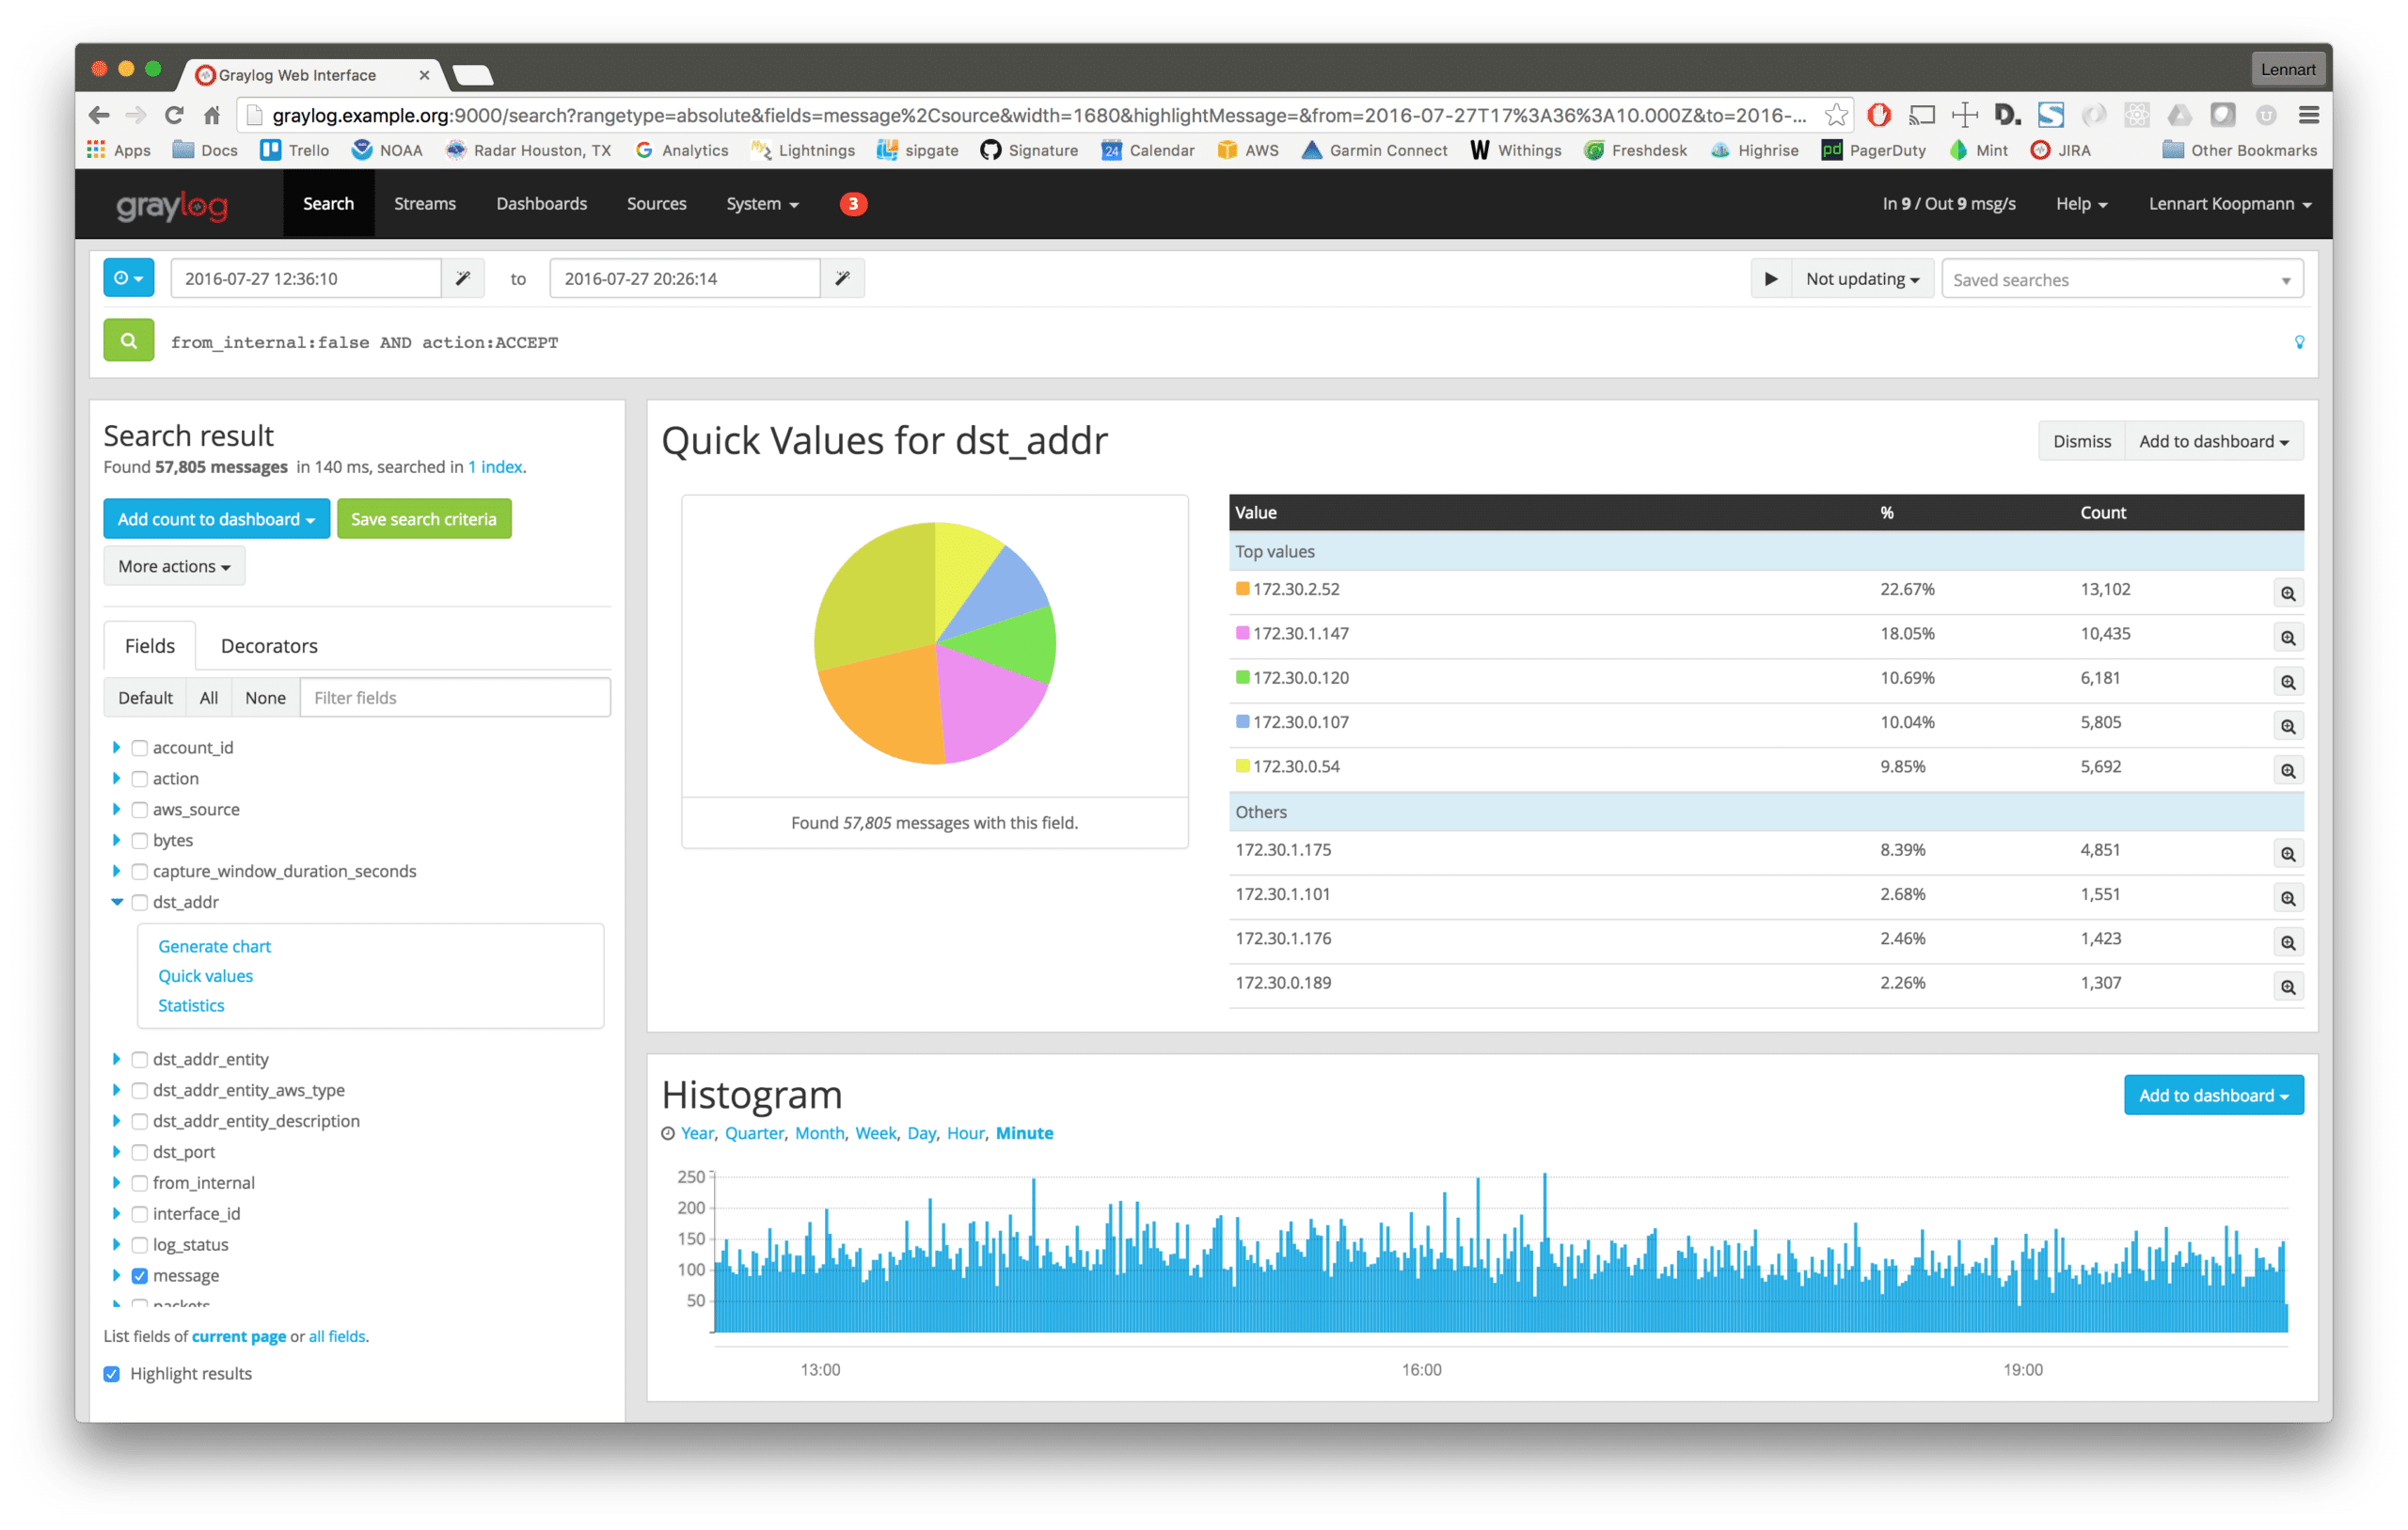
If you find a system that accepts outside connections but should not, refine the Graylog query a little to see what is communicating with it:
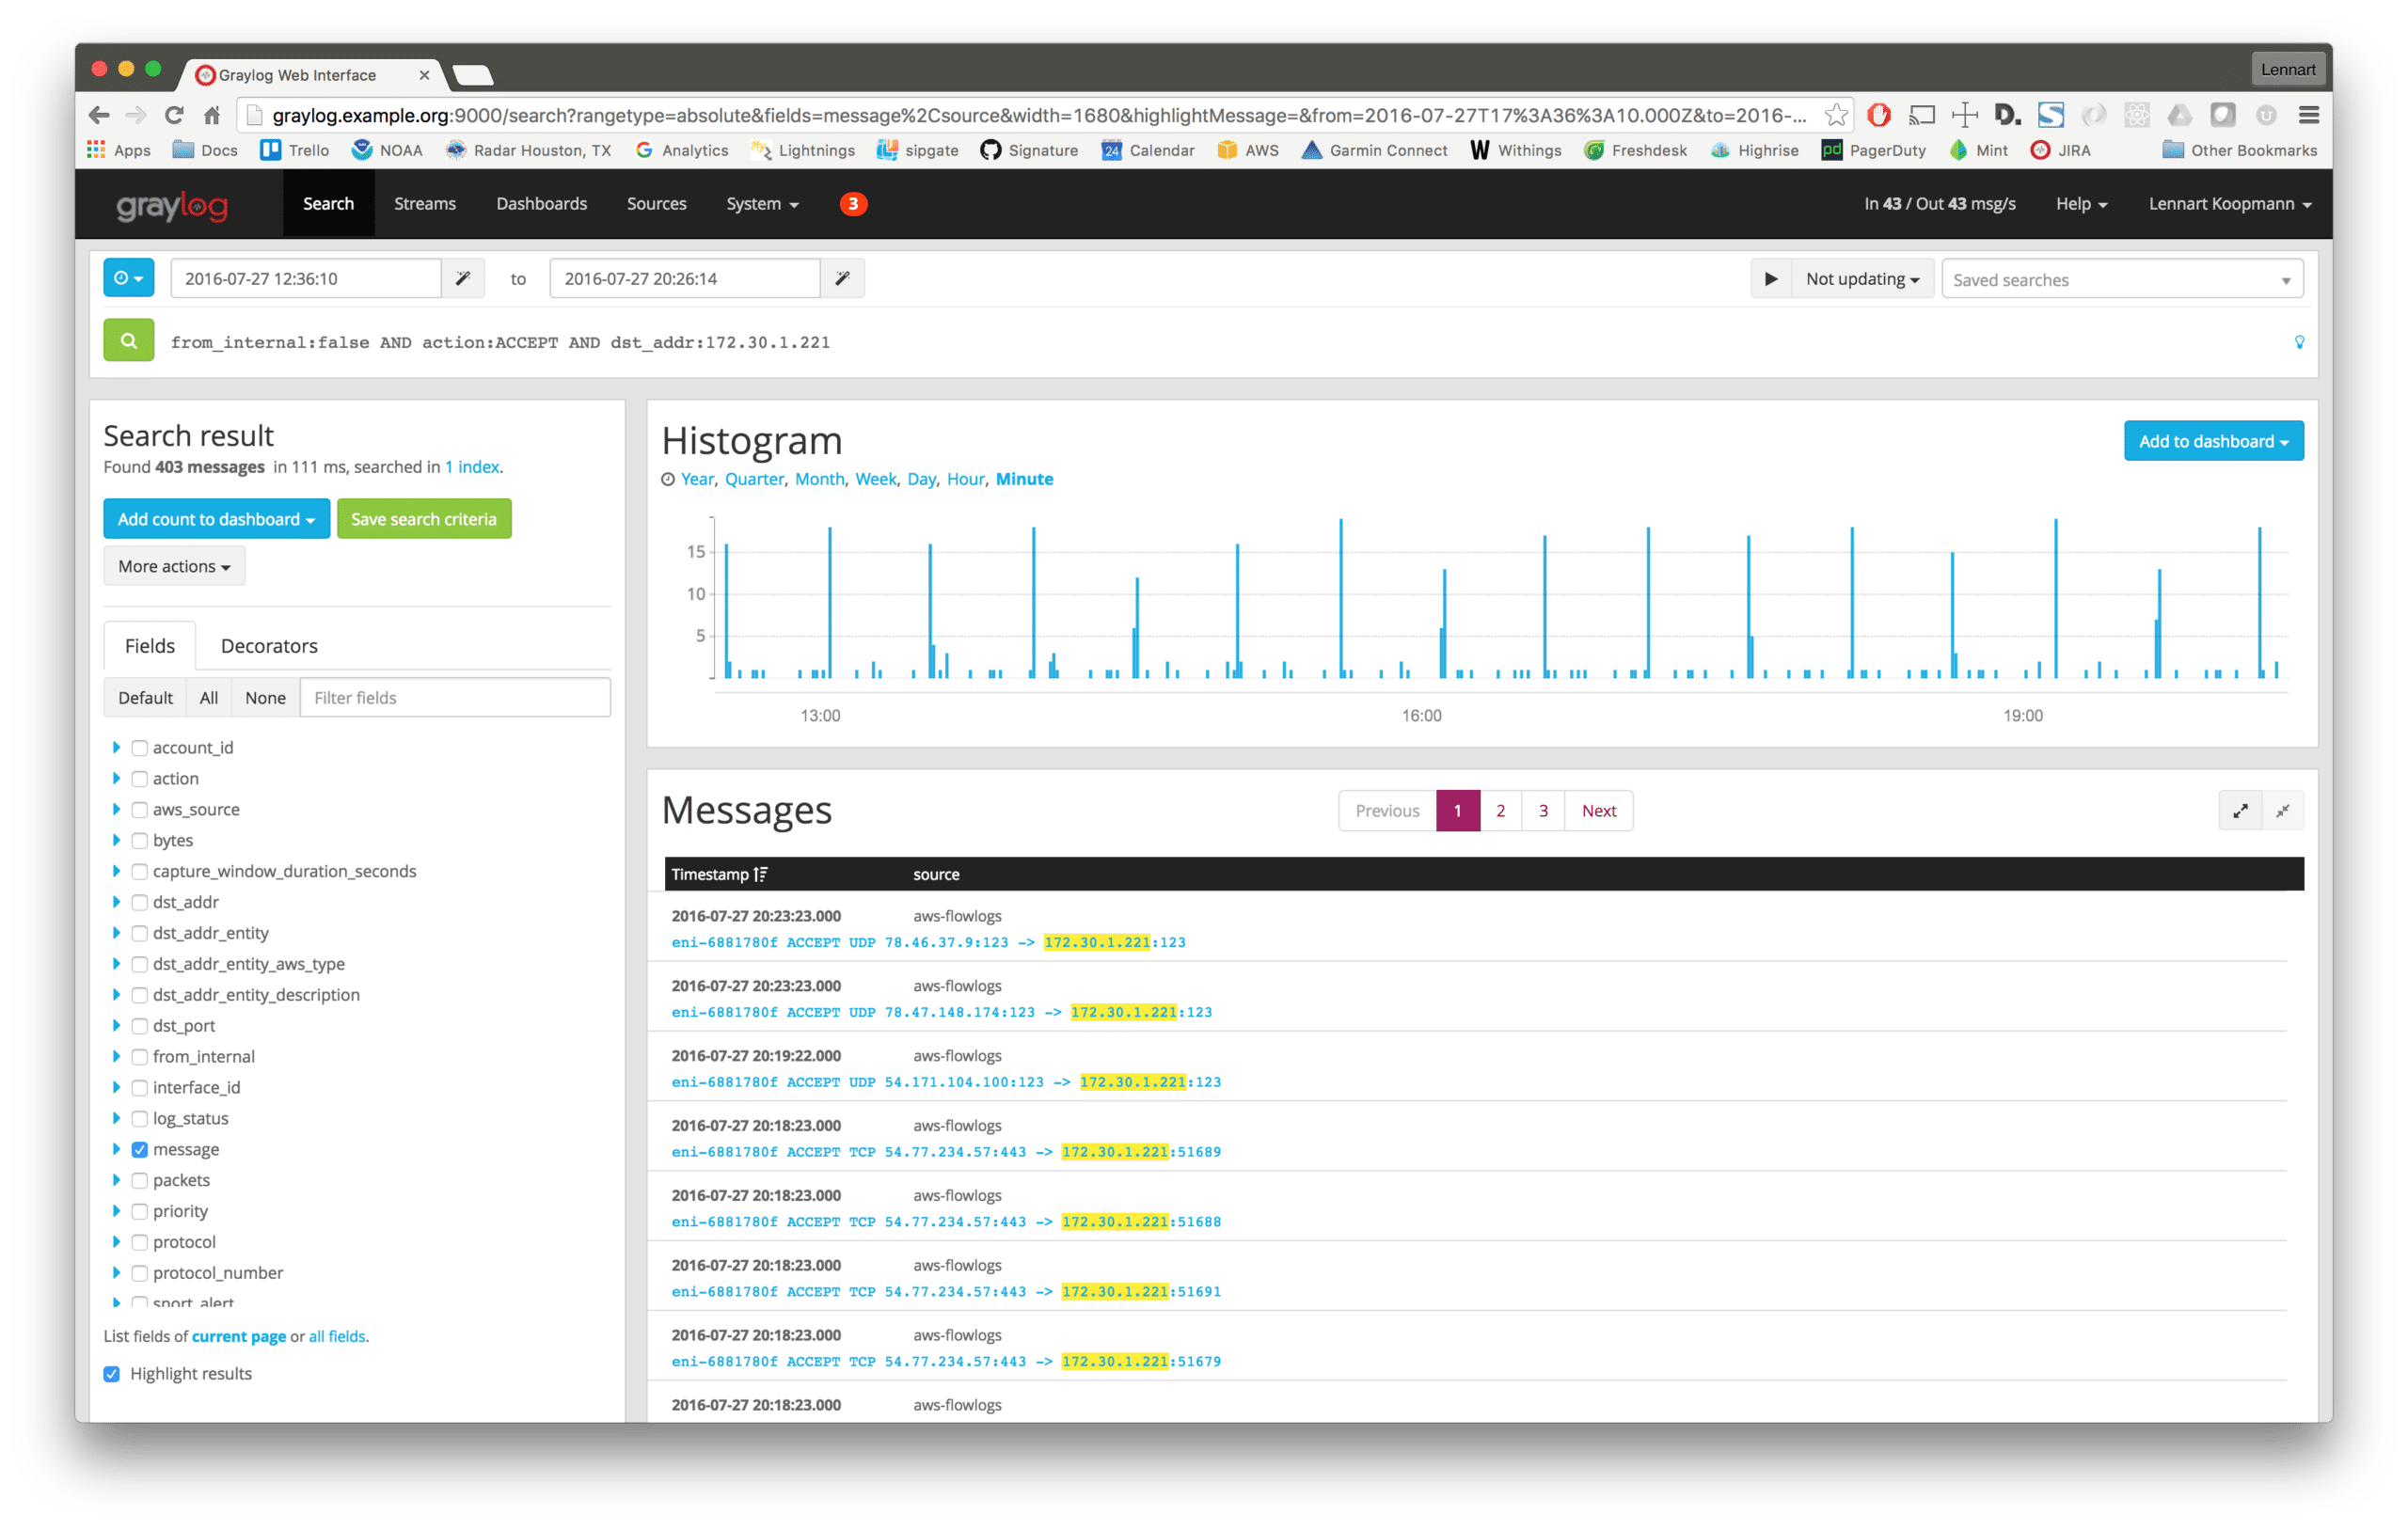
Use this analysis to find and then fix all cracks by tightening your firewall rules.
The from_internal field is added by a Graylog pipeline rule like this:
rule “determine if connection originated from internal IP”
when
has_field(“aws_source”) && has_field(“src_addr”)
then
set_field(“from_internal”, cidr_match(“172.30.0.0/16”, to_ip($message.src_addr)));
end
(It adds from_internal=true to every message that has the field src_address set to an IP address in the 172.30.0.0/16 network.)
Another useful pipeline step is to enrich messages with DNS lookups of IP addresses so messages with the field dst_addr:172.30.0.16 also get another field like dst_addr_hostname:filesrv1. (Our AWS plugin does that automatically for EC2, ELB and RDS instances)
2. Data flow from databases and file servers
Find out where bytes flow to from sensitive data repositories like databases or file servers:
src_addr:172.30.0.86 AND (src_port:3306 OR src_port:22)
You can also get a graphical analysis of the total number of bytes that are leaving a specific IP address with Graylog:
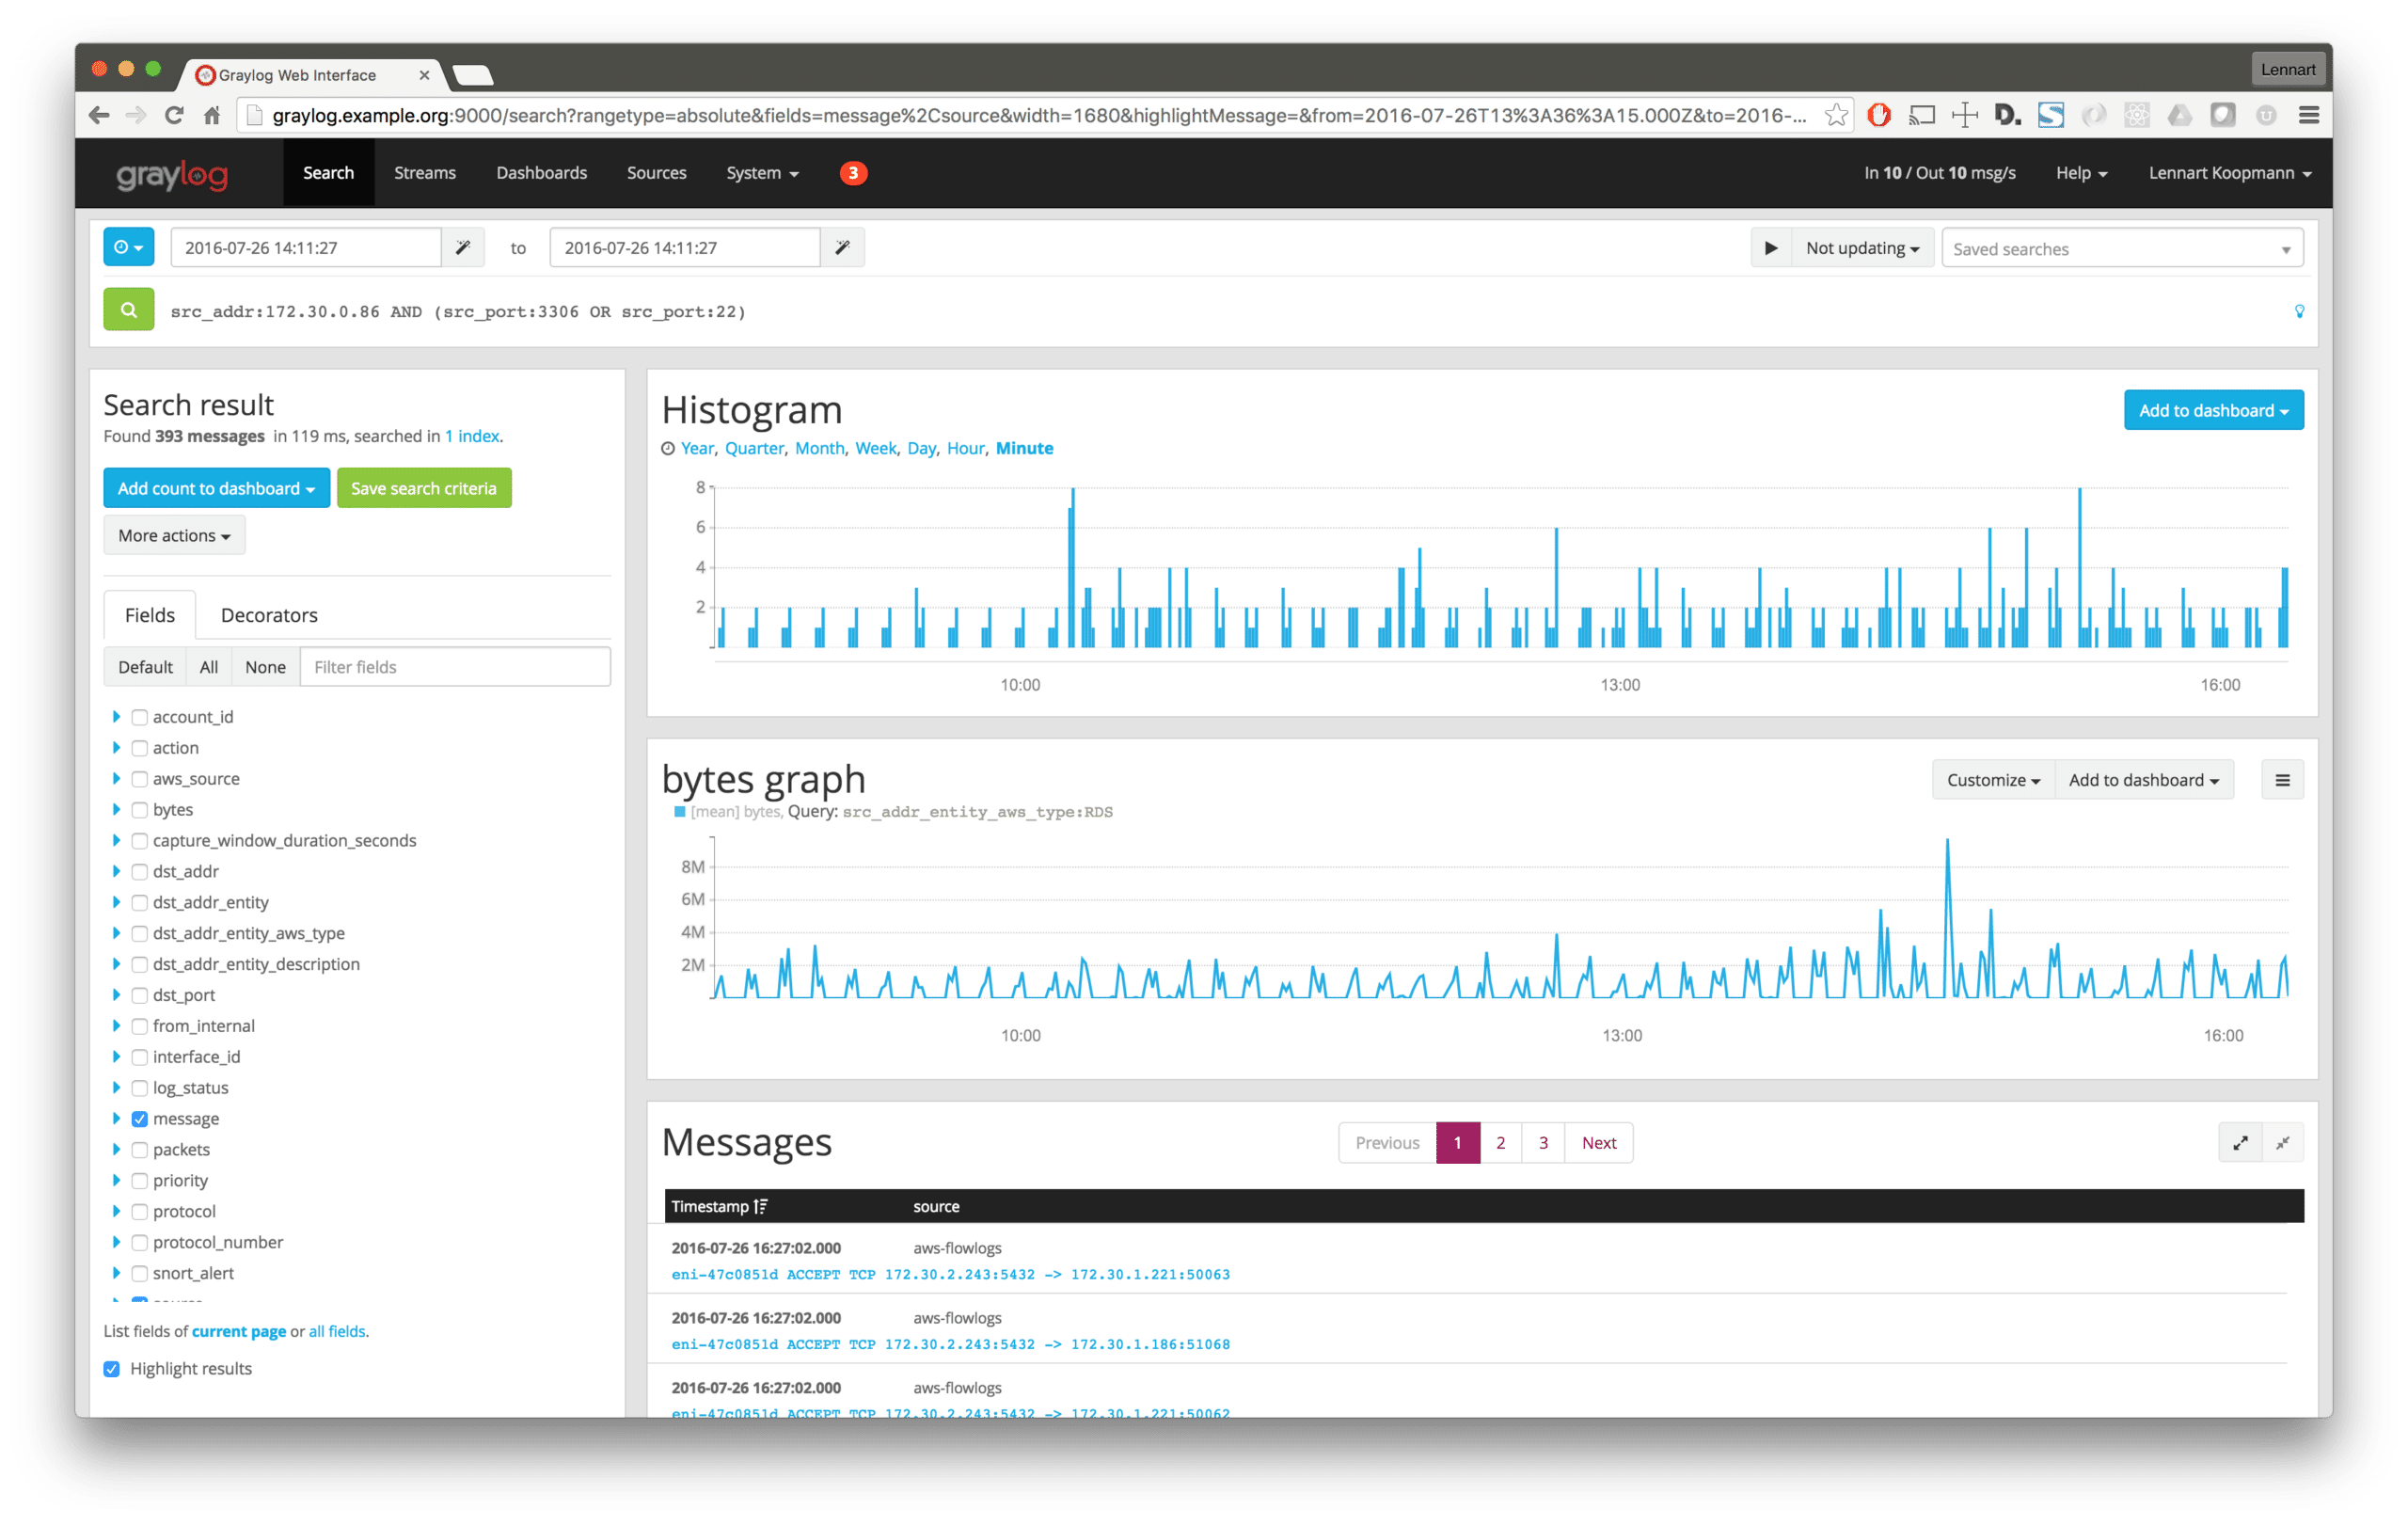
Now you can go in and analyze where the data landed, using a quickvalues analysis on the destination address (dst_addr) field. You should always search for unusual connections.
The same concept/theory applies for workstations of users. In many cases, workstations should never transfer huge amounts of data, especially not outside of your networks.
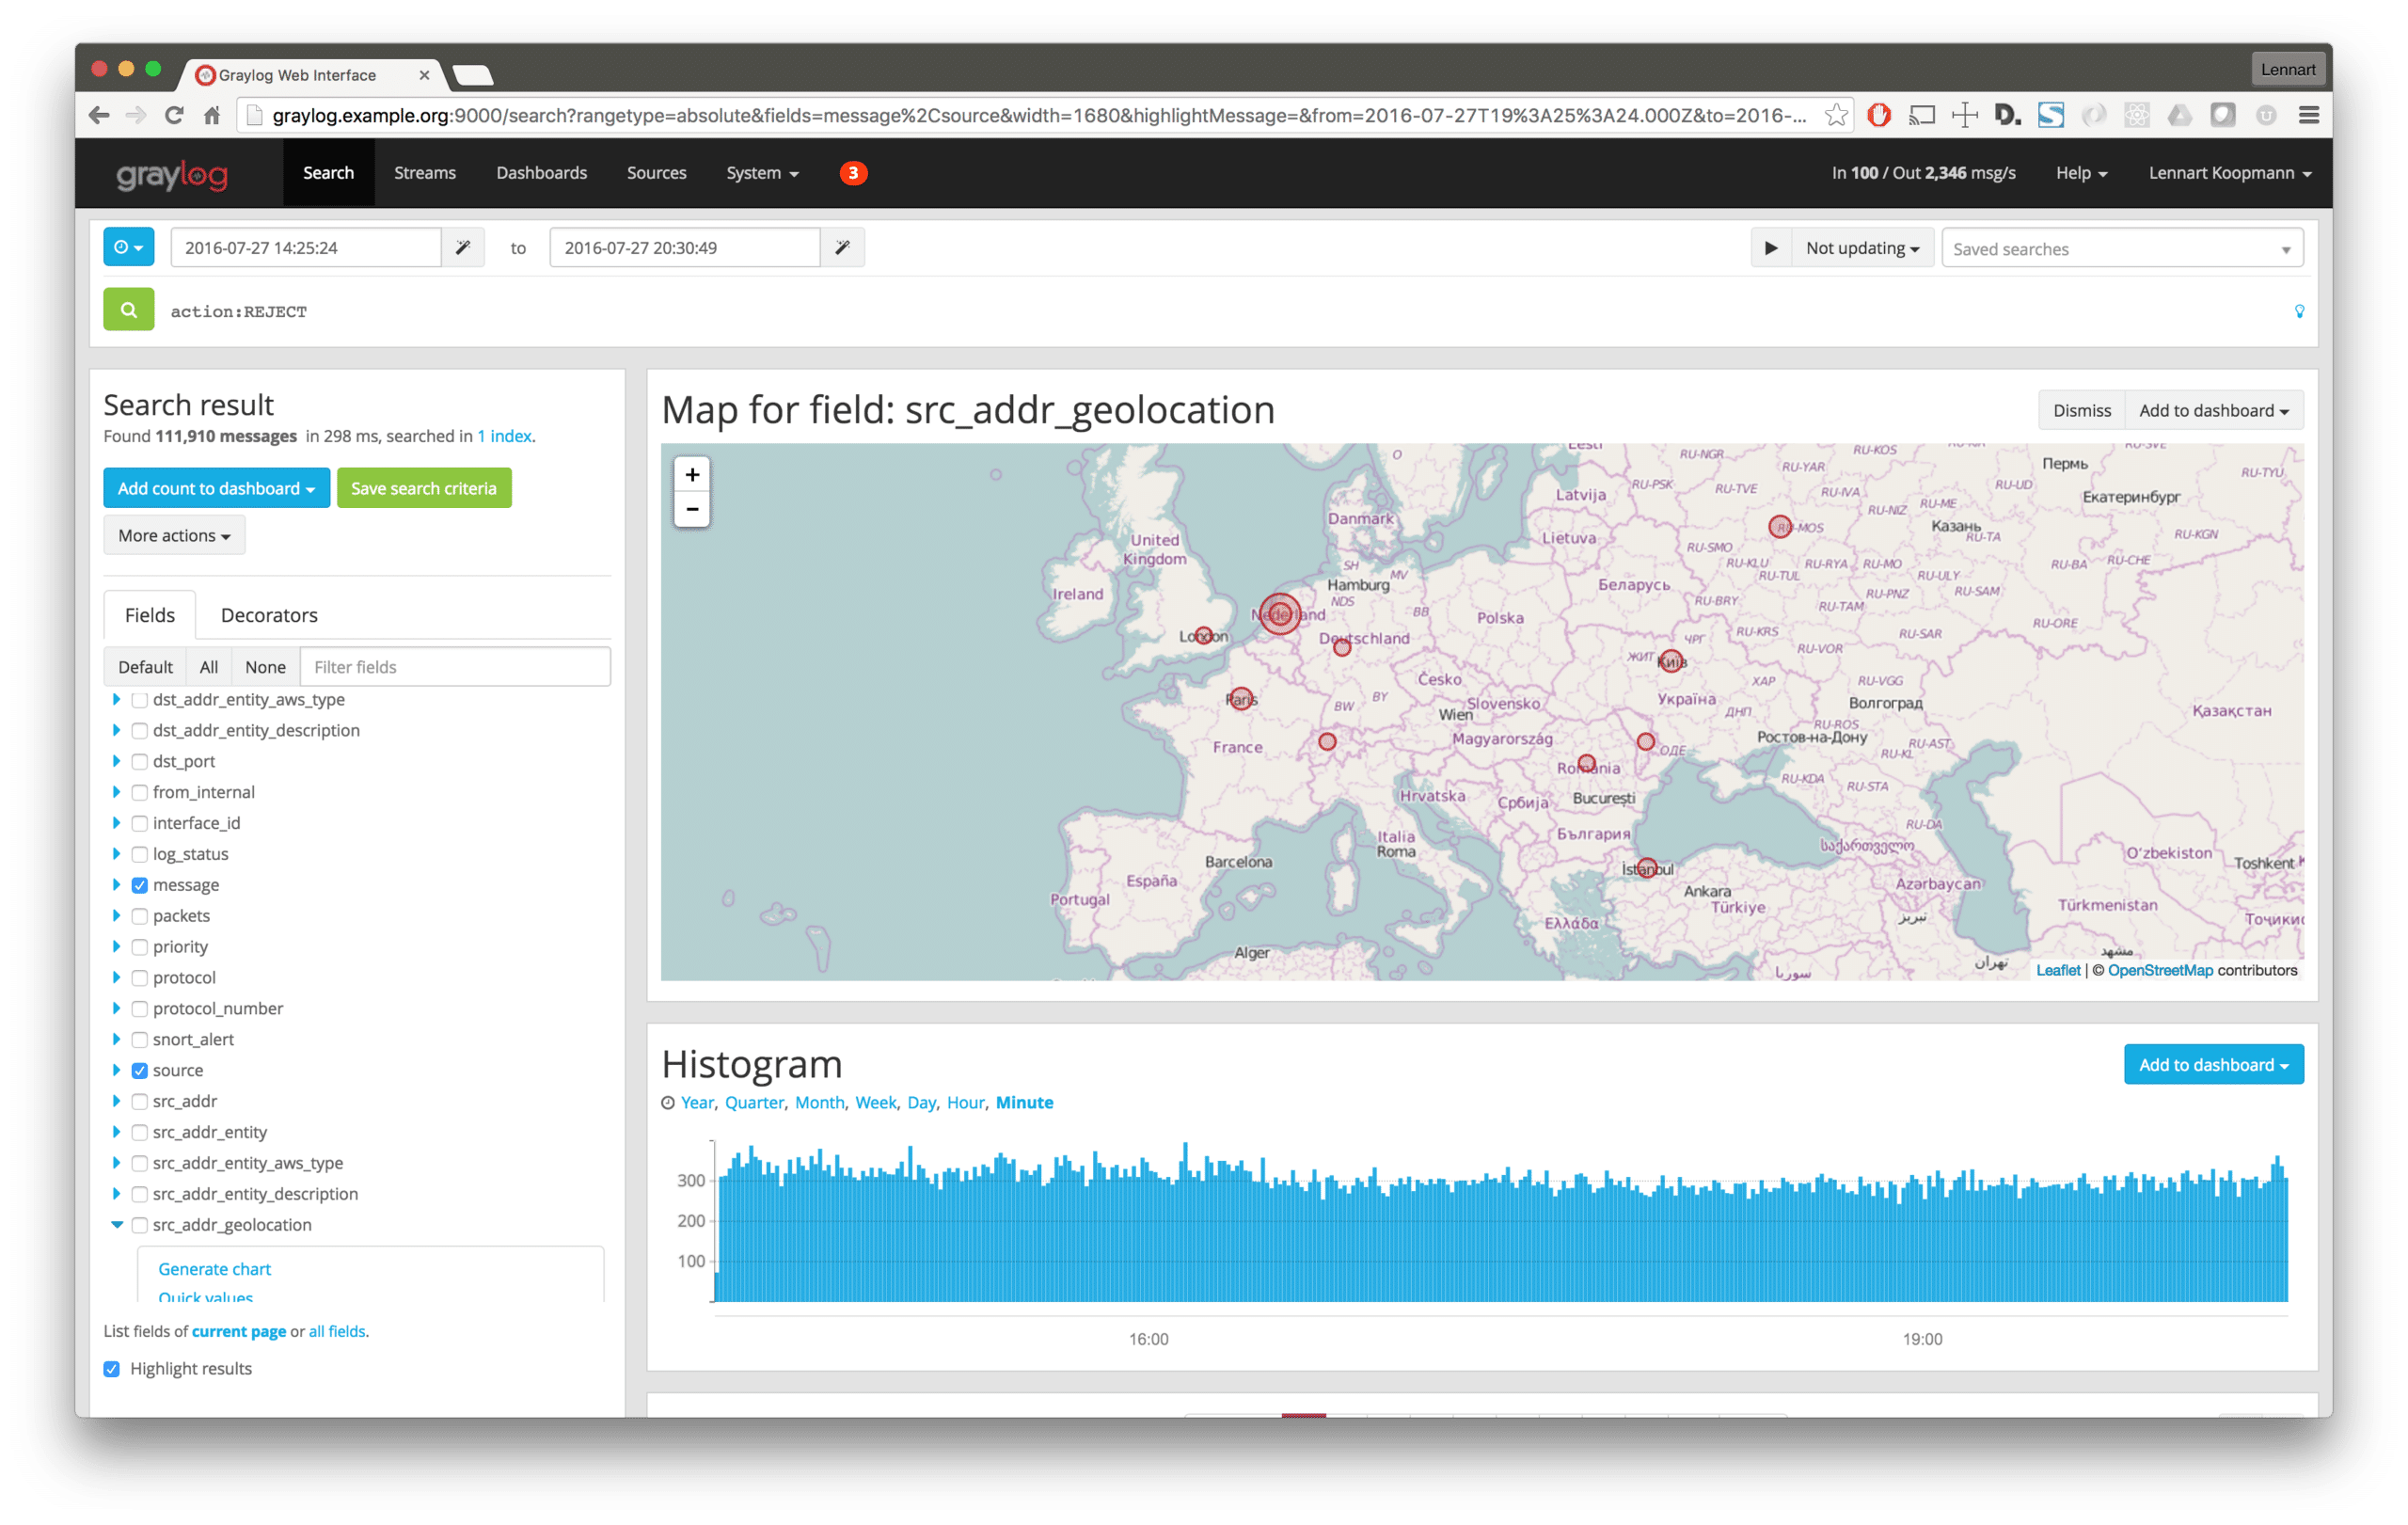
You can create a geo analysis to see where the data is going and to find unusual activity faster:
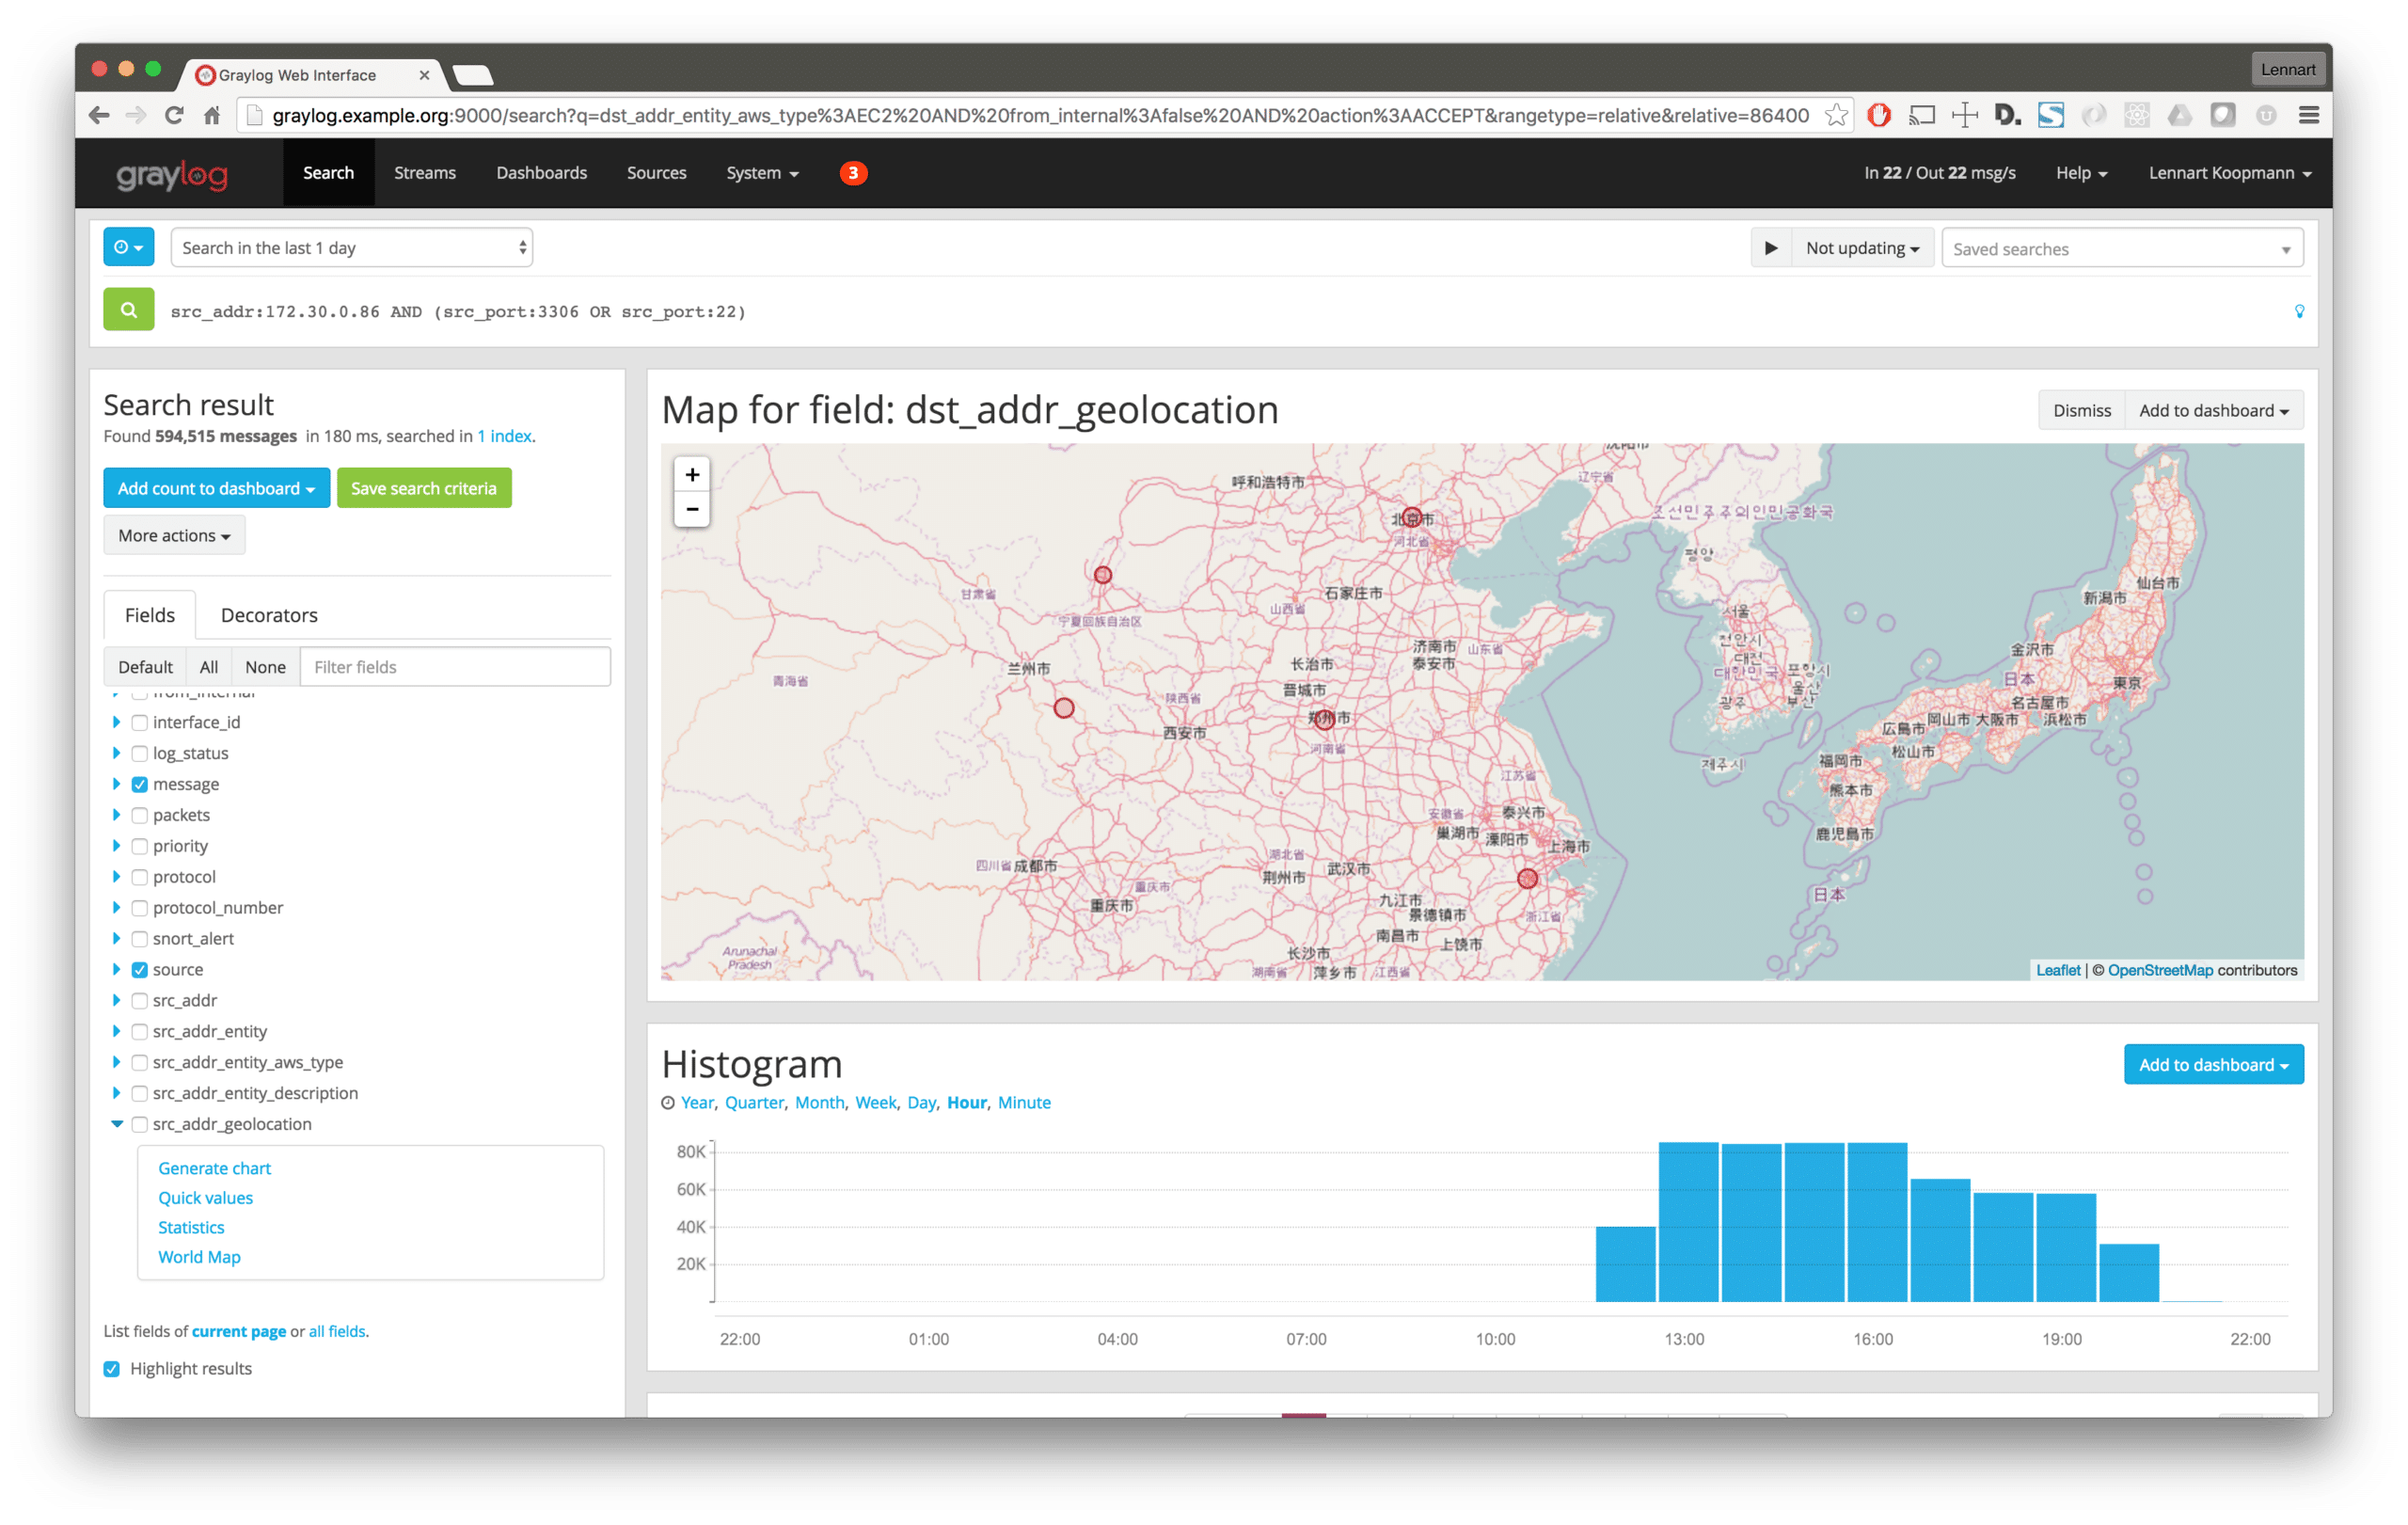
If all your workstations or employees with restricted access are in a special network, you could add a is_workstation=true field for easier querying later. Do this with another Graylog pipeline rule:
set_field(“is_workstation”, cidr_match(“172.10.0.0/16”, to_ip($message.src_addr)));
Bonus points for configuring a Graylog alert to trigger whenever the data flow from a database server to unusual destinations exceeds a certain threshold.
3. Rejected connections
Many rejected connections are indicators of scans or attackers who are trying to learn more about your network. (See our previous blog post about the 5 phases of intrusion)
The Graylog query for this could not be easier:
action:REJECT
Run a quickvalues analysis to find the IP addresses that caused the most rejected connections:
A geo analysis of this is helpful here, too:
This can usually be safely automated. Use a Graylog alert callback to automatically block IP ranges in your firewalls.
Anything else
There are many more examples on ways to find malicious activity, but this article can provide ideas of where to start.
When analyzing your logs, you will most likely find harmless, automated scans on your infrastructure. However, if attackers do make it through firewalls and to private information, you have a record of cracks in your infrastructure and will need to block access as soon as possible. You should also focus your attention to improving security measures in your system.
It is also necessary to alert law enforcement and specialized security companies immediately if attackers have been detected within your networks.
Set up dashboards and alerts
Dashboards
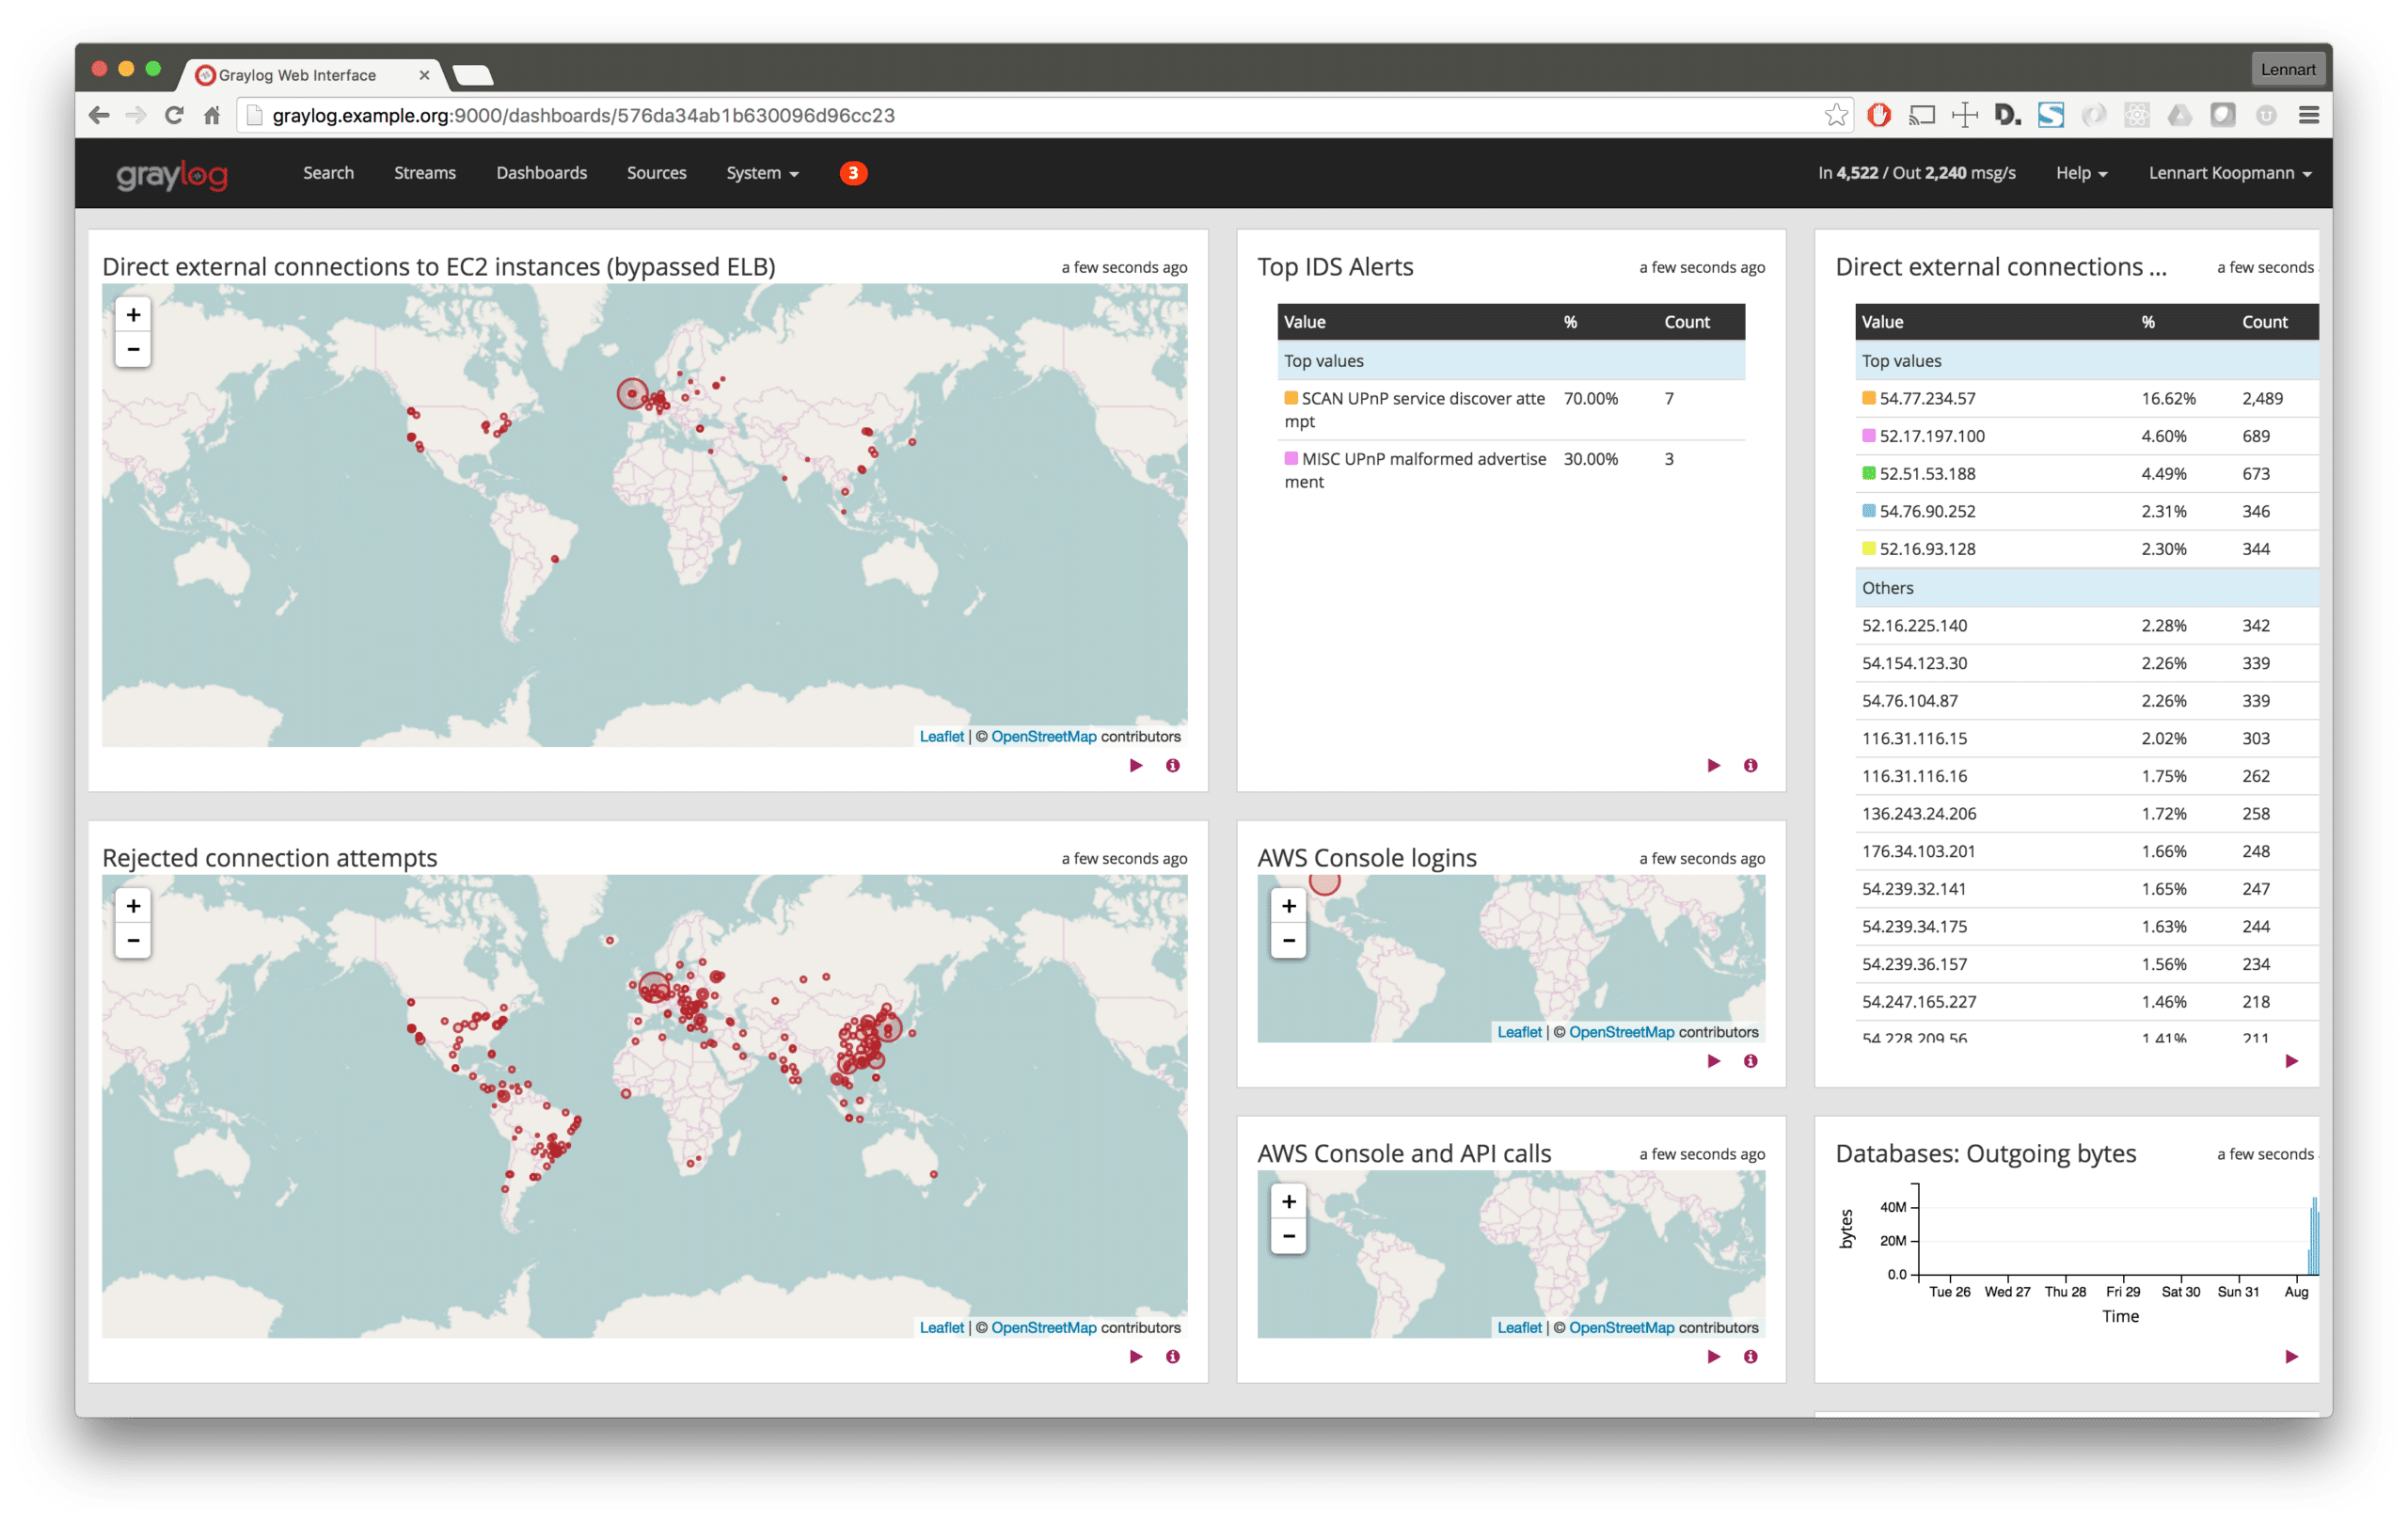
With the huge amount of data and information coming in every second, it is important to have measures in place that help you keep an overview, and not miss any suspicious activity.
Dashboards are a great way to get operational awareness without having to do manual searches and analysis. Every minute you invest in good dashboards will save you time in the future.
Alerts
Some suspicious activity can even be detected by Graylog automatically when you configure quality alert condition rules. For example, you could trigger an email or Slack message the moment a login to your system from outside of you trusted network occurs. Then, investigate the activity in Graylog.
The next post in this series
In the next post we’ll talk about how Open Source intrusion detection systems (IDS) can inspect the package contents and send alerts to Graylog for powerful analysis and correlation.
