Cyber Defense with MITRE Framework | Graylog + SOC Prime | On-Demand Webinar >> ​

Feature

Reports & Dashboards

Dashboards and reports are a fundamental component of any SIEM or enterprise log management system. But not all such systems are as intuitive and customizable as Graylog. With a full range of visualizations, filters, and drill-downs, it is easy to have the exact data you want at your fingertips.

Graylog Reports & Dashboards

How It Works:

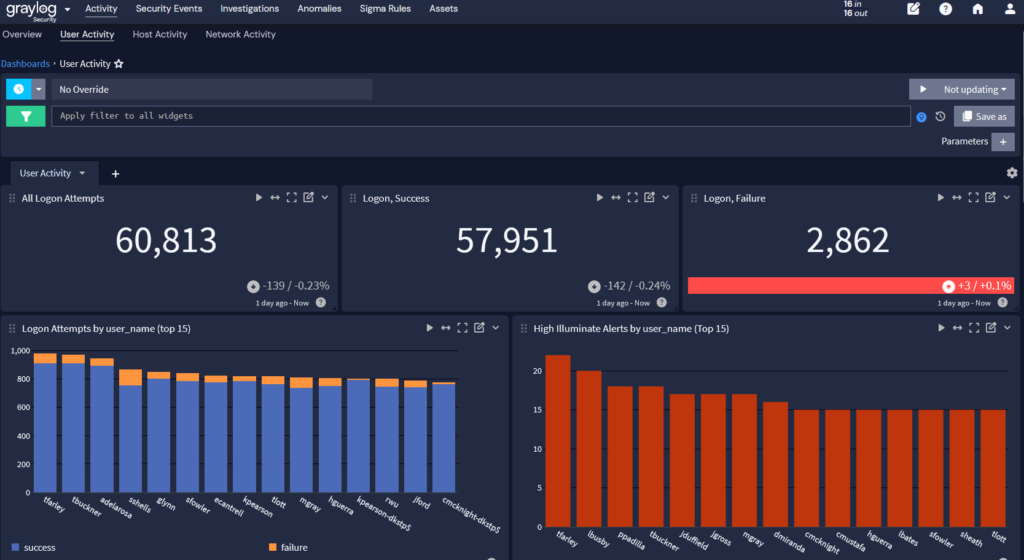
At the core of reports and dashboards is a versatile framework that supports prebuilt and custom dashboard creation. This flexibility enables users to create their analytics views to specific needs, enhancing the decision-making process. Users can drag and drop various data visualization widgets, configuring them to display the most relevant data for their specific use cases. Once created, share your visualizations with others in your Graylog environment.

Prebuilt dashboards in Graylog Illuminate offer a quick start with industry-standard analytics and views, enabling immediate insights into compliance, performance metrics, and security threats.

Reports introduce a scheduling functionality, enabling dashboards to be transformed into comprehensive reports over flexible timeframes. This capability is crucial for maintaining tailored data retention, providing extended context, and understanding trends over time. Whether for immediate insights or long-term analysis, reports and dashboards ensure data is accessible, understandable, and actionable.

Security User Activity

Learn More About Reports and Dashboards

Dashboards in log management serve as a visual interface that aggregates and displays key metrics and data points derived from log files. They provide real-time visibility into system performance, security threats, and operational trends, allowing IT professionals and decision-makers to quickly assess the health and security of their IT infrastructure.  Customizable dashboards enable users to focus on specific metrics most relevant to their needs, facilitating faster decision-making and problem resolution.

Reports in log management compile and present detailed data and analyses based on log files over a specified period. They are essential for in-depth analysis, compliance audits, and historical trend analysis. By generating regular reports, organizations can track changes over time, identify patterns or anomalies, and make informed decisions regarding their IT environment. Reports also play a crucial role in compliance, providing documented evidence of security monitoring and incident handling.

Integrating dashboards and reports into a log management system brings several benefits, including:

Enhanced Visibility: Provides a unified view of data across various sources, making it easier to monitor and analyze.

Improved Efficiency: Saves time and resources by automating data aggregation and visualization, reducing the need for manual log review.

Informed Decision-Making: Facilitates data-driven decisions by presenting actionable insights in an accessible format.

Compliance and Auditing: Assists in meeting regulatory requirements by generating comprehensive reports on security and operational activities.

Customizable dashboards and reports cater to diverse user needs by allowing individuals to tailor the information displayed according to their specific roles and responsibilities. For example
  • System Administrators might focus on dashboards showing server health, performance metrics, and alert summaries to ensure system reliability.
  • Security Analysts may prioritize dashboards and reports that highlight potential security breaches, unauthorized access attempts, and vulnerability scans to mitigate threats.
  • Compliance Officers could utilize reports detailing audit trails, incident response activities, and policy adherence to ensure regulatory compliance.
This flexibility ensures that all stakeholders have access to relevant, actionable insights tailored to their operational focus.